Operations | Monitoring | ITSM | DevOps | Cloud


The latest News and Information on Log Management, Log Analytics and related technologies.


Distributed alerting with the Elastic Stack
Modern computing environments and distributed workforces have produced new challenges to traditional information security approaches. Many traditional threat detection and response strategies rely on homogeneous environments, system baselines, and consistent control implementations. These strategies have been built on traditional environment assumptions that may no longer be true in your environment with the evolution of cloud computing, remote work, and modern culture.
Mezmo Pipeline for Telemetry Data

See how reliability management enhancements expand your SLO value

Importing your Cloudwatch Metrics into Prometheus
Cloudwatch is the de facto method of consuming logs and metrics from your AWS infrastructure. The problem is, it is not the de facto method of capturing metrics for your applications. This creates two places where observability is stored, and can make it difficult to understand the true state of your system. That’s why it has become common to unify all data into one place, and Prometheus offers an open-source, vendor-agnostic solution to that problem.

A new year with a new look and many more...
Simplified analysis. Enhanced visualizations, alerting capabilities, advanced data forwarding, and more. Great news! We have published a new update with many exciting new features and optimizations.
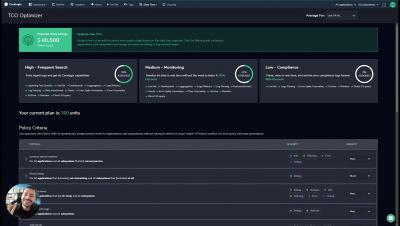
Save 40-70% of Your Observability Costs with Coralogix TCO

Introducing the Cribl Stream Reference Architecture

How to Create a Dashboard in Kibana

Better troubleshooting with a new Cloud Logging plugin for Grafana
You can now use the Cloud Logging datasource plugin to view your logs in Grafana.