Operations | Monitoring | ITSM | DevOps | Cloud

Logging

The latest News and Information on Log Management, Log Analytics and related technologies.

Uniting Tracing and Logs With OpenTelemetry Span Events

The current landscape of what our customers are dealing with in monitoring and observability can be a bit of a mess. For one thing, there are varying expectations and implementations when it comes to observability data. For another, most customers have to lean on a hodgepodge of tools that might blend open source and proprietary, require extensive onboarding as team members have to learn which tools are used for what, and have a steep learning curve in general.

Elastic 7.12 released: General availability of schema on read, technical preview of the frozen tier, and support for autoscaling

We are pleased to announce the general availability (GA) of Elastic 7.12. This release brings a broad set of new capabilities to our Elastic Enterprise Search, Observability, and Security solutions, which are built into the Elastic Stack — Elasticsearch and Kibana.

Directly search S3 with the new frozen tier

We’re thrilled to announce the technical preview of the frozen tier in 7.12, enabling you to completely decouple compute from storage and directly search data in object stores such as AWS S3, Microsoft Azure Storage, and Google Cloud Storage. The next major milestone in our data tier journey, the frozen tier significantly expands your data reach by storing massive amounts of data for the long haul at much lower cost while keeping it fully active and searchable.

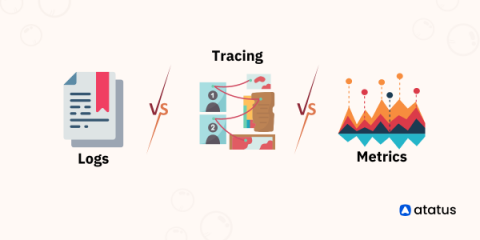
Introducing Atatus Log Monitoring

Log Monitoring is a crucial step in ensuring to know what’s happening in all your servers from a single location. Did you know Log Monitoring tools are implemented by the strategy called “defense-in-depth”? Boom!!! That’s where the log monitoring concept developed, and now we have many log monitoring tools in the market. Issues that users face in the log monitoring tool: We considered all the above points while we designed our tool.

Tutorial | How to Set Up LogDNA Ingestion Source

Centralize your logs from any source in LogDNA so that you can monitor and troubleshoot your systems and applications in a single UI. In this video, I’ll show you how to add an ingestion source. We support multiple ingestion sources, which you can learn about in our documentation portal below. In this video, we’ll show you how to ingest Kubernetes logs using the LogDNA Agent.

Tutorial | How to Custom Parsing with LogDNA

LogDNA automatically parses common log types so that you can easily view and search through them. If you have logs that aren't in a format we automatically parse, you can create a custom parsing template so they'll be parsed as well, allowing you to use them in views, alerts, boards, and graphs. In this video, we will show you how to use Custom Parsing templates for a log that we don't automatically parse, such as one from an internal application.

Tutorial | How to use LogDNA Screens

Use LogDNA Screens to display daily log activity from all of your systems or select systems. Use time-shifted graphs to aggregate data from the previous week to compare activity levels in your current week. Our screens let you create an easy-to-read dashboard containing widgets that convey metrics from your logs. These include graphs, gauges, tables, and time-shifted graphs. In this video, we'll create a screen with widgets that provide different views of your webserver's 404s.

Aggregating Application Logs From EKS on Fargate

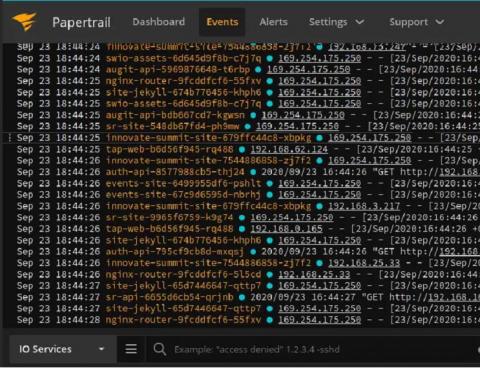
Today we’re going to talk about logging with Kubernetes on AWS using CloudWatch and SolarWinds® Papertrail™. We’ll cover setting up Papertrail, installing and configuring the rKubeLog package, viewing the logs in the Papertrail event viewer, and cross-checking those logs with the ones we see with kubectl. From there, we’ll set up a few different alerts.

Elastic recognized as a Challenger in the 2021 Gartner Magic Quadrant for Insight Engines

We’re excited to announce that, as a new entrant in the 2021 Gartner Magic Quadrant for Insight Engines, Elastic has been recognized as a Challenger. You can download the complimentary report today. Read on to learn more about creating powerful, modern search experiences with Elastic Enterprise Search.