Operations | Monitoring | ITSM | DevOps | Cloud

The latest News and Information on Log Management, Log Analytics and related technologies.

Serverless Architecture Explained: Easier, Cheaper, FaaS vs BaaS & Evolving Compute Needs

Want to build websites and apps in a way that’s both easier and cheaper? Well, it’s possible even for major organizations and international companies. In this article, let’s take a look at how serverless architecture and computing is changing the game for software developers. We’ll start at the very beginning and walk through how serverless works, how we got this far, and the pros & cons of this approach.


Monitoring and troubleshooting - Apache error log file analysis

Your Apache HTTP server access and error logs contain a wealth of actionable insights about potential server configuration and web application issues. The problem is that this information is hidden within millions of log messages, so you need analytics to efficiently extract these insights so you can respond to problems before they impact your users. Apache log analysis revolves around two activities: monitoring and troubleshooting.

What is log management in DevOps?

DevOps teams are used to working with data that is spread out across lots of different systems and environments. In organizations that have achieved tight collaboration with security teams to transition to DevSecOps, this is even more true! Log management is part of how all these teams keep track of information and make vital business decisions. It’s important to take a moment to understand what is meant by log management.

What is log management in security?

Cyber crimes are expected to cost the world roughly $10.5 trillion per year by 2025, according to Cybersecurity Ventures. And these attacks don’t just cost money. Businesses impacted by these kinds of crimes can expect to experience not only financial losses but also loss of productivity, damage to their reputation, potential legal liabilities and more.

What is log management used for?

Faced with an important business decision? Do you have the data you need to make it? Odds are, you probably don’t. Or, if the data is captured somewhere, can you count on it being in one place and easily accessible? This is a common issue, easily solved by proper log management. This practice is vital for data-driven businesses, helping you maintain security, troubleshoot operations more quickly and enhance user experience.

Ship OpenTelemetry Data to Coralogix via Reverse Proxy (Caddy 2)

It is commonplace for organizations to restrict their IT systems from having direct or unsolicited access to external networks or the Internet, with network proxies serving as gatekeepers between an organization’s internal infrastructure and any external network. Network proxies can provide security and infrastructure admins the ability to specify specific points of data egress from their internal networks, often referred to as an egress controller.

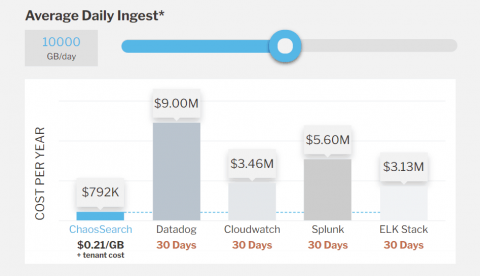
ChaosSearch Pricing Models Explained

ChaosSearch was built for live analytics at scale on cloud storage. Our architecture was designed for high volume ingestion of streams & analytics at scale via ElasticSearch & Trino API via a stateless fabric that can scale to meet the customers’ scale & latency requirements. Because we don’t store any data, under the hood, ChaosSearch is basically a set of containers that are deployed in cloud compute instances in a dedicated VPC to each customer managed by ChaosSearch.

How to Cut Through SIEM Vendor Nonsense

If you’re in need of new SIEM tooling, it can be more complicated than ever to separate what’s real and what’s spin. Yes, Logz.io is a SIEM vendor. But we have people in our organization with years of cybersecurity experience, and they wanted to share thoughts on how best to address the current market. Our own Matt Hines and Eric Thomas recently hosted a webinar running through what to look out for titled: Keep it SIEM-ple: Debunking Vendor Nonsense. Watch the replay below.

How to monitor Kafka and Confluent Cloud with Elastic Observability

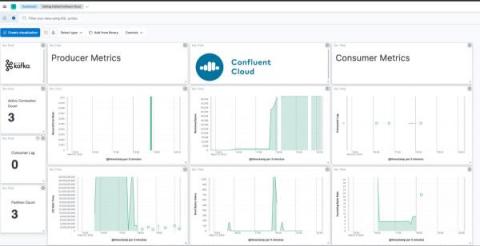
The blog will take you through best practices to observe Kafka-based solutions implemented on Confluent Cloud with Elastic Observability. (To monitor Kafka brokers that are not in Confluent Cloud, I recommend checking out this blog.) We will instrument Kafka applications with Elastic APM, use the Confluent Cloud metrics endpoint to get data about brokers, and pull it all together with a unified Kafka and Confluent Cloud monitoring dashboard in Elastic Observability.