Infrastructure UI for Kubernetes and Docker using Elasticsearch and Kibana
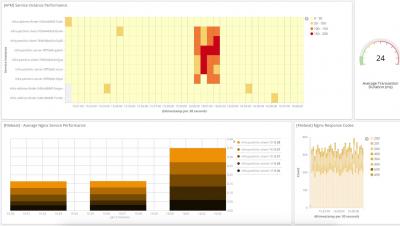
The Elastic Stack comes with powerful data visualization capabilities. Filebeat and Metricbeat modules, as well as, Elastic APM ship with pre-built Kibana dashboards that serve as a great starting point for exploring logs, metrics, and APM data in Kibana. On top of that, the Infrastructure, Logs, and APM UIs enable common workflows for correlating the data coming from different operational contexts.


