Operations | Monitoring | ITSM | DevOps | Cloud

Latest News

Sentry's New Java Agent: Adding Context to Your Stack Traces

We’re enhancing the existing Sentry Java SDK with our new Java agent. The thing is — it’s still in beta, and we need your feedback. Once downloaded, the agent will enhance your application stack traces on Sentry by adding the names and values of local variables to each frame. Specifically, the agent provides much more detail about the current state of the application at the time of the error than you would usually have.

Key metrics for Elasticsearch performance monitoring

Elasticsearch is a highly scalable, distributed, open-source RESTful search and analytics engine that offers log analytics, real-time application monitoring, click stream analytics, and more. Elasticsearch stores and retrieves data structures in real time. It has multi-tenant capabilities with an HTTP web interface, presents data in the form of structured JSON documents, makes full-text search accessible via RESTful API, and maintains web clients for languages like PHP, Ruby, .Net, and Java.

Jenkins in a Nutshell

In many projects, the product development workflow has three main concerns: building, testing, and deployment. Each change to the code means something could accidentally go wrong, so in order to prevent this from happening developers adopt many strategies to diminish incidents and bugs. Jenkins, and other continuous integration tools (CI) are used together with a source version software (such as GIT) to test and quickly evaluate the updated code.

Monitoring Java using JMX and custom metrics

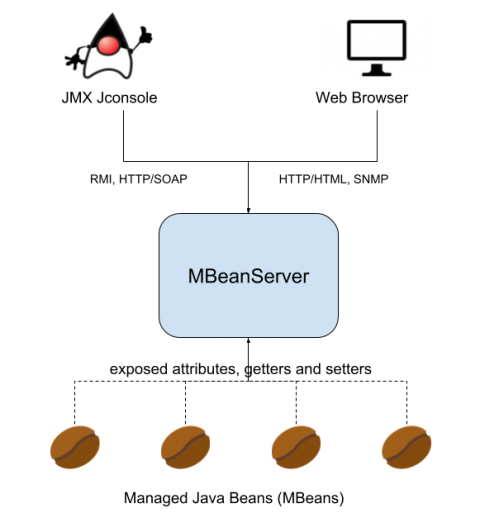
JMX (Java Management Extensions) is a set of specifications conceived to monitor and manage Java applications. To implement the JMX technology, you need to create and register MBeans (Managed Beans) as part of your Java code. Using JMX technology and tools, Java application developers can get the dynamic state of the application and use it for performance tuning, troubleshooting and debugging.

An Opinionated List of Skills You Need for a DevOps Job in 2018

The world of DevOps is a pretty confusing place for folks just starting out. Even figuring out what “DevOps” means can be hard. Is it CI/CD with Kubernetes and Serverless to drive Agile product iterations? Or is it SSH-ing into a box and restarting Apache? You guessed it. All of the above and most things in between.

Intrinsic vs Meta Tags: What's the Difference and Why Does it Matter?

Tag-based metrics are typically used by IT operations and DevOps teams to make it easier to design and scale their systems. Tags help you to make sense of metrics by allowing you to filter on things like host, cluster, services, etc. However, knowing which tags to use, and when, can be confusing. For instance, have you ever wondered about the difference between intrinsic tags (or dimensions) and meta tags with respect to custom application metrics? If so, you’re not alone.

Monitor your domain, SSL certificate, blacklists and robots.txt

Super Monitoring introduced a new type of check: “Daily Health”, which checks once a day the domain and SSL certificate’s expiration dates, the validity of the certificate, presence of the site on blacklists and detects whether the website is blocking search engine robots.

Monitoring and Managing Locks in Postgres with Foglight

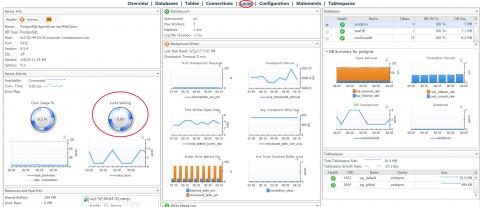
One of the most valuable capabilities of Postgres is its support for concurrent ACID transactions. ACID is an acronym for Atomicity, Consistency, Isolation, and Durability. These database transaction properties help verify data validity. It is important to understand that locking can be a common occurrence in active Postgres databases. This is because Postgres uses these levels of locking as one of the ways to safely implement these (concurrent ACID) transactions.