Have you ever been in a job situation where you have no idea what to do? You look at the others, and they appear to be just as confused as you are, and you realize that no one else has any clue about what they should be doing either. If you run a business, you quickly learn that good communication is paramount and one of the primary keys to maintaining a productive business. Communication affects every single aspect of your workplace, especially when it comes to your place of operations.
“Automation” and “orchestration” are terms that frequently appear within the same sentence – which is unsurprising, because they are closely related. In fact, they’re so similar in meaning that it can be easy to confuse their meanings or assume that there is basically no real difference between security automation and orchestration. But, as with many concepts in the world of IT and security (“observability” vs.
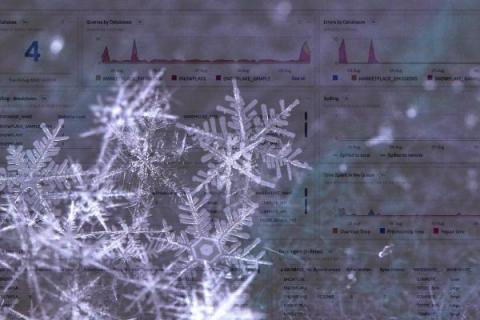
You’ve probably heard something like this before: “It’s a managed service! We don’t need to worry about anything!” But when it comes to your production workloads, database monitoring is imperative. With the new Snowflake Dashboards and Detectors in the Splunk Observability Content Contributors repository you can start seeing the details of individual Snowflakes.
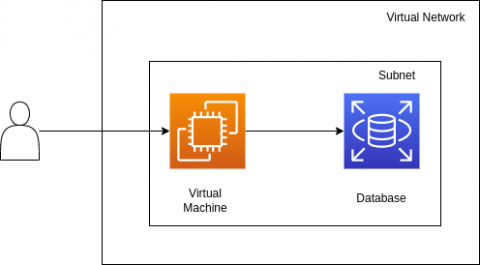
In this tutorial, we'll deploy a simple web app to the cloud of your choice - composed of a database and a virtual machine where the frontend code will run. So that the configuration is reusable and consistent, we'll write it in Terraform. Usually Terraform configurations are cloud-specific, and changing clouds requires a complete rewrite. In this case, so that you can reuse the same configuration across clouds, we'll be using Multy.
Food retailers reduce the workload accumulated by their IT areas by almost 30% thanks to monitoring. Controlling data and extensive information from the whole company, by controlling, supervising and ordering everything through the same system, allows to reduce the times of action in the face of possible errors and failures, improves resource management and organization and increases the effectiveness of the business activity. In addition, monitoring saves costs.
LogSnag is the new kid on the block, but we bet that it will become relevant in this space soon. Today we will show you how to monitor outages and get alerts for your third-party services within LogSnag. What is LogSnag? Here's the intro, but you can learn more at LogSnag official website.
Logs are key to monitoring the performance of your applications. Kubernetes offers a command line tool for interacting with the control plane of a Kubernetes cluster called Kubectl. This tool allows debugging, monitoring, and, most importantly, logging capabilities. There are many great tools for SREs. However, Kubernetes supports Site Reliability Engineering principles through its capacity to standardize the definition, architecture, and orchestration of containerized applications.