Operations | Monitoring | ITSM | DevOps | Cloud

Latest News

Outreach Engages Their Production Code with Honeycomb

Outreach is the number one sales engagement platform with the largest customer base and industry-leading usage. Outreach helps companies dramatically increase productivity and drive smarter, more insightful engagement with their customers. Outreach is a privately held company based in Seattle, Washington. Tech Environment & Tools: Millions of Logs and Limited View Metrics.

Observability 101: Terminology and Concepts

When I first started following Charity on Twitter back in early 2019, I was quickly overwhelmed by the new words and concepts she was discussing. I liked the results she described: faster debugging, less alert fatigue, happier users. Those are all things I wanted for my team! But I was hung up on these big polysyllabic words, which stopped me from taking those first steps toward improving our own observability.

Logs and Traces: Two Houses Unalike in Dignity

Intelligent Medical Objects (IMO) and its clinical interface terminology form the foundation healthcare enterprises need, including effective management of Electronic Health Record (EMR) problem lists and accurate documentation. Over 4,500 hospitals and 500,000 physicians use IMO products on a daily basis. With Honeycomb, the engineering team at IMO was able to find hidden architectural issues that were previously obscured in their logs.

Getting Metrics Into Honeycomb

Honeycomb is an event-based observability tool. Rather than relying on the rigid pre-aggregated measures provided by metrics, Honeycomb instead favors using events because they provide a much greater degree of flexibility. But that doesn’t mean metrics don’t belong in Honeycomb. Our new whitepaper, Getting Started With Honeycomb Metrics, breaks down exactly how to do that.

Event in Review: Splunk's DevOps & Observability Best Practices Event

Last week, Catchpoint was one of the sponsors of Splunk’s half-day DevOps & Observability Best Practices event. It was a jampacked conference that examined what observability is, its key drivers, and how observability and monitoring exist “like two peas in a pod”, perfect compliments to one another in enabling enterprise to better understand overall systems behavior and health.

Galileo and Splunk: Ensuring Patient Trust with Serverless Observability

When it comes to patient care, convenience and trust are critical to success. Healthcare startup Galileo prioritizes just that through technology that gives people 24/7 access to medical care and improves the dialogue between patients and their doctors. Galileo ensures uptime, minimizes latency, and reduces errors so patients get the help they need when they need it and can ultimately live better, healthier lives.

Monitoring infrastructure and microservices with Elastic Observability

Trends in the infrastructure and software space have changed the way we build and run software. As a result, we have started treating our infrastructure as code, which has helped us lower costs and get our products to market more quickly. These new architectures also give us the ability to test our software faster in production-like deployments, and generally deliver more stable and reproducible deployments.

Monitoring vs Observability: What's the Difference?

Monitoring has never been simple, but there was a time when it was simpler. You had a device you could collect data from; you knew the metrics you needed to monitor, and if something went wrong, you could find the root cause. But as IT becomes increasingly and exponentially more complex, more devices, more environments, more things to monitor, more updates, more data, more everything; monitoring in general needs to grow with it.

Monitoring Java applications with Elastic: Multiservice traces and correlated logs

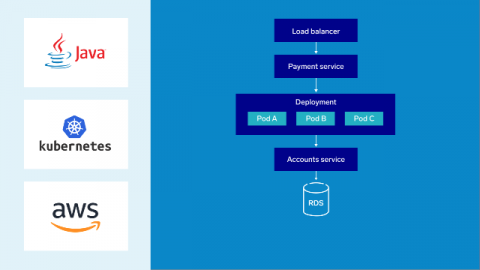
In this two-part blog post, we’ll use Elastic Observability to monitor a sample Java application. In the first blog post, we started by looking at how Elastic Observability monitors Java applications. We built and instrumented a sample Java Spring application composed of a data-access microservice supported by a MySQL backend. In this part, we’ll use Java ECS logging and APM log correlation to link transactions with their logs.