Operations | Monitoring | ITSM | DevOps | Cloud

Latest News

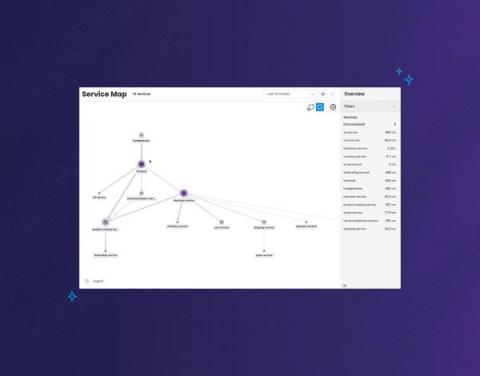
Introducing Honeycomb Service Map: A Dynamic, Interactive, and Actionable View of Your Entire Environment

Today, we're announcing the launch of Honeycomb Service Map. This isn't your grandparent's version of a service map. This feature reimagines what it is that you want to know or investigate when looking at visualizations of how your services communicate with one another.

Harvester 1.1.0: The Latest Hyperconverged Infrastructure Solution

The Harvester team is pleased to announce the next release of our open source hyperconverged infrastructure product. For those unfamiliar with how Harvester works, I invite you to check out this blog from our 1.0 launch that explains it further. This next version of Harvester adds several new and important features to help our users get more value out of Harvester. It reflects the efforts of many people, both at SUSE and in the open source community, who have contributed to the product thus far.

Run self-hosted CI jobs in Kubernetes with container runner

Container runner, a new container-friendly self-hosted runner, is now available for all CircleCI users. Self-hosted runners are a popular solution for customers with unique compute or security requirements. Container runner reduces the barrier to entry for using self-hosted runners within a containerized environment and makes it easier for central DevOps teams to manage running containerized CI/CD jobs behind a firewall at scale.

New Honeycomb Features Raise the Bar for What Observability Should Do for You

As long as humans have written software, we’ve needed to understand why our expectations (the logic we thought we wrote) don’t match reality (the logic being executed). To that end, we developed techniques to help measure reality—logging text strings, or capturing aggregated metrics—and persevered, seeking out newer and fancier logging or monitoring solutions over the intervening decades.

Enhance the Value of Your Data With Mezmo's Observability Pipeline

Organizations of all sizes rely on their observability data to drive critical business decisions. Production Engineers across Development, ITOps, and Security use it to understand their systems better, respond to issues faster, and ultimately provide more performant and secure user experiences. But while the value of observability data is well understood, teams struggle to derive value from it.

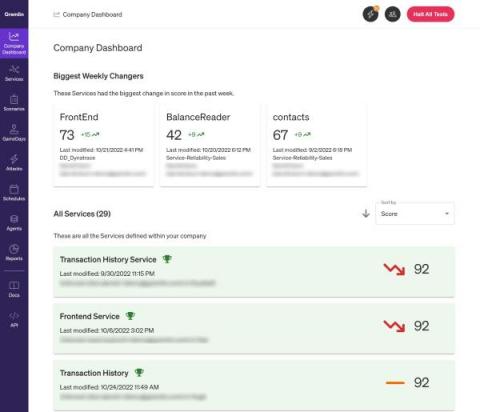
Managing and improving reliability using Gremlin's Reliability Dashboard

Part of a successful reliability program is being able to monitor and review your progress toward improving reliability. Being able to run tests on services is a big part of it, but how can you tell you're making progress if you can only see your latest test results? There should be a way to track improvements or regressions in your reliability testing practice across your organization in a way that's easy to digest. That's where the Reliability Dashboard comes in.