Operations | Monitoring | ITSM | DevOps | Cloud
Ways to balance your data across Apache Kafka partitions
Apache Kafka in the Airline, Aviation and Travel Industry
Apache Kafka is the de facto standard for event streaming use cases across industries. Many use cases can be applied to the aviation industry, too. Concepts like payment, customer experience, and manufacturing differ in detail. But in the end, it is about integrating systems and processing data in real-time at scale. For instance, omnichannel retail with Apache Kafka applies to airline, airports, global distribution systems (GDS), and other aviation industry sectors.
3 Trade-offs to Consider When Deploying Apache Kafka in the Cloud
Maximizing the value of streaming data requires carefully navigating operational tradeoffs when developing and managing cloud native applications. Organizations that are rapidly producing and processing high volumes of data — like Netflix, Salesforce, Shopify and even the United States Postal Service (USPS), are constantly applying and testing new methods to manage the complexity of data streaming in the cloud.
Introducing Klaw for Apache Kafka governance
Aiven welcomes Kafkawize, now Klaw
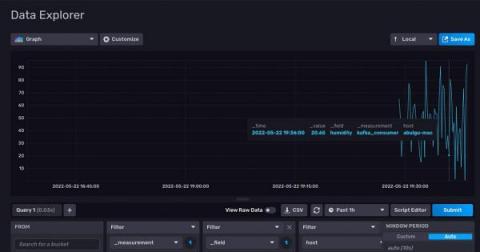
Getting Started with Apache Kafka and InfluxDB
The number of applications and services increases every day as more application architectures move towards microservices or serverless structures. You can process this increasing amount of time series data with real-time aggregation or with a calculation whose output is a measurement or a metric. These metrics need to be monitored so that you can solve issues and make relevant changes in your system quickly. A change in a system can be captured and observed in many ways.
Connecting Apache Kafka and Aiven for ClickHouse
Integration with Apache Kafka
You can integrate Edge Flow Manager (EFM) with Apache Kafka and forward agent heartbeats to defined Kafka topics. Learn how to perform the integration with Apache Kafka. To integrate EFM with Kafka, you need to configure Kafka and EFM properties. EFM supports the forwarding of agent heartbeats and acknowledges messages exchanged on the C2 protocol between the EFM server and MiNiFi agents.


