Running systems in production involves requirements for high availability, resilience and recovery from failure. When running cloud native applications this becomes even more critical, as the base assumption in such environments is that compute nodes will suffer outages, Kubernetes nodes will go down and microservices instances are likely to fail, yet the service is expected to remain up and running.
I have seen many junior data scientists and machine learning engineers start a new job or a consulting engagement for a telecom company coming from different industries and thinking that it’s yet another project like many others. What they usually don’t know is that “It’s a trap!”. I spent several years forging telecom data into valuable insights, and looking back, there are a couple of things I would have loved to know at the beginning of my journey.
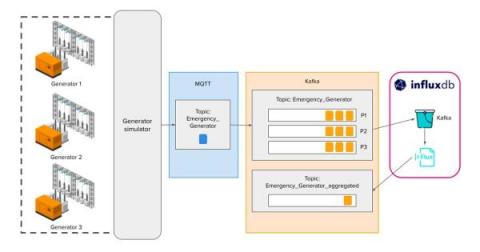
Data streaming is important for getting insights in real time and reacting to events as fast as possible. Its application is wide, from banking transactions and website click analytics to IoT devices and motorsports. The last example represents a really interesting use case.
As software is evolving away from monoliths and towards service-based architectures, it is becoming more apparent than ever that logging performance needs to be a first-class consideration of our architectural designs. This article will explore how to build and maintain a logging solution for a microservice-oriented containerized application, how to address some common difficulties which come with running such a solution, plus some tips for debugging and eliminating bottlenecks.
Running systems in production involves requirements for high availability, resilience and recovery from failure. When running cloud native applications this becomes even more critical, as the base assumption in such environments is that compute nodes will suffer outages, Kubernetes nodes will go down and microservices instances are likely to fail, yet the service is expected to remain up and running.
Last week, we had an issue with one of our Kafka brokers. Don’t worry, it didn’t impact any customers. When monitoring things closely, you can often solve things before they impact a customer ;-). In today’s post, I’ll show you how we use AppSignal to dogfood our own issues. I’ll go through how we monitor the non-Ruby part of our stack and how we used AppSignal to detect and resolve the issue.
At LogicMonitor, we deal primarily with large quantities of time series data. Our backend infrastructure processes billions of metrics, events, and configurations daily. In previous blogs, we discussed our transition from monolith to microservice. We also explained why we chose Quarkus as our microservices framework for our Java-based microservices. In this blog we will cover.