Operations | Monitoring | ITSM | DevOps | Cloud

Introducing Prometheus-style alerting for Grafana Cloud

Hi! My name’s Richard Lam, and I’m the new product manager for Grafana Cloud. I’m really excited for my first contribution to this community, both so I can introduce myself to you all, and so I can highlight an awesome new Grafana Cloud feature that’s coming your way! Happy reading, and hopefully this is just the start of many more communications from me.

TrackJS for Node

TrackJS error monitoring, on your servers. We’re thrilled to announce official support for Node environments and the 1.0.0 release of our Node agent. We’ve actually had Node since sometime last year, but we’re finally formalizing it as a first-class citizen and fully-supported part of TrackJS! Here are some of the cool things you can do with TrackJS for Node.

More Chatbots - Slack, Mattermost, Microsoft Teams, and Google Chat

Today, we are excited to announce PagerTree has added 3 new chatbot services including Mattermost, Microsoft Teams and Google Hangouts Chat (this is in addition to our core Slack notification channel). Chatbots are available on all pricing tiers free of charge! :) If you don’t already have an account, sign up for a free-trial now. Our chatbots are will post alert details to a “channel” of your choice.

Update Statuspage using the new Uptrends integration

Atlassian, the maker of Opsgenie (We have an integration for Opsgenie too!), also offers Statuspage. Statuspage is a communication tool that allows users to view the current and recent past status of a website, API, or web application. In addition to a hosted status notification page, Statuspage also sends out messages to users to keep them informed about your site’s availability. Now Uptrends can automatically send updates to Statuspage using the new integration.

New monitoring agent in Go: Glouton

Bleemeo announces the General Availability of the new monitoring agent written in Go. This agent is the successor of the previous agent written in Python. All good aspects have been kept: Open Source, easy to deploy, and to use, available as a package for main Linux distributions: Debian/Ubuntu, CentOS/RedHat, available for Windows and available as a container.

Introducing the redesigned Check Statistics widget

Those of you, who’ve already tried out the Web Interface for Icinga DB might have noticed the redesigned layout of the check execution statistics section in a monitoring object’s detail view. For all the others: Learn about it in this post. On first hand we wanted to make the informations more compact and put them in relation with each other, where possible. We aimed to keep all the information of the old one, though.

LM Container: Introducing Support for AWS Bottlerocket

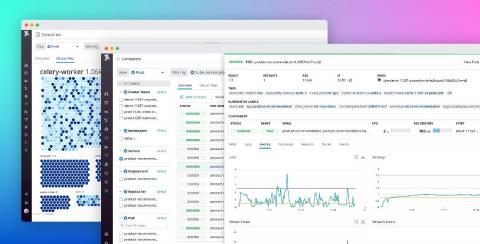
Hybrid IT environments enable Enterprises to optimize factors such as performance, cost, agility, and security, but they also introduce complexity. Containers are a great way to reduce some of this complexity by standardizing how applications are developed and deployed.