What's Observability with AIOps? Check Out Our New Book, Webinars and Infographic
Discover how DevOps and SREs can develop more and operate less by applying AI to events, metrics, traces and logs to keep CI/CD agile and your business growing.


The latest News and Information on Monitoring for Websites, Applications, APIs, Infrastructure, and other technologies.
Discover how DevOps and SREs can develop more and operate less by applying AI to events, metrics, traces and logs to keep CI/CD agile and your business growing.
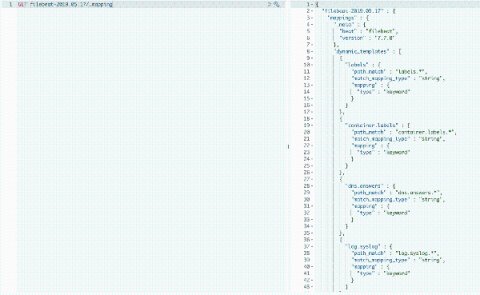
There are two ways you can view the current mappings on your Logit ELK Stacks. One way is to use dev tools in Kibana. You can access Kibana from any of your dashboards by choosing from your dashboard Stack settings > Access Kibana. You can also search for a specific mapping of an Index name. For example if we wanted to see the mappings for the a Filebeat index name we can run the following to return only the desired mappings.
SAN FRANCISCO — July 22, 2020 — InfluxData, creator of the time series database InfluxDB, today announced that InfluxDB Cloud is now available on Microsoft Azure, furthering the company’s commitment to increase accessibility to developers. With this announcement, InfluxDB Cloud is now live on all three major cloud platforms — Microsoft Azure, Google Cloud and Amazon Web Services.
In Part 1, we looked at some best practices for getting started with creating effective test suites for critical application workflows. In this post, we’ll walk through best practices for making test suites easier to maintain over time, including: We’ll also show how Datadog can help you easily adhere to these best practices to keep test suites maintainable while ensuring a smooth troubleshooting experience for your team.
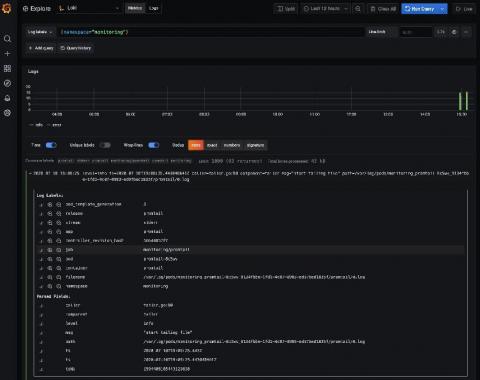
Amazon Elastic Kubernetes Service (Amazon EKS) is the fully managed Kubernetes service on AWS. If you’re using it and wondering how to query all your logs in one place, Loki is the answer. With this tutorial, you’ll learn how to set up Promtail on EKS to get full visibility into your cluster logs while using Grafana. We’ll start by forwarding pods logs then nodes services and finally Kubernetes events.
Imagine it’s 3 AM, you’ve just been paged for a critical issue- queues filling up quickly, and you don’t know why. You turn to logs, looking for something abnormal, a change that could explain what is happening so you can fix it. Sound familiar? Unfortunately, searching through logs to uncover changes is a time-consuming process.
OneLogin is one of the top leading Unified Access Management platforms, enabling organizations to manage and Access their cloud applications in a secure way. OneLogin makes it simpler and safer for organizations to access the apps and data they need anytime, everywhere. This post will show you how Coralogix can provide analytics and insights for your OneLogin log data – including performance and security insights.