Operations | Monitoring | ITSM | DevOps | Cloud

The latest News and Information on Monitoring for Websites, Applications, APIs, Infrastructure, and other technologies.

Cribl Search Unlocks The Value of ALL Data

We announced Cribl Search in May, and customer reaction has been incredibly positive. We’ve heard for some time that organizations have data everywhere. They have data in their observability lakes, analytics tools, object stores, and at the edge. The big challenge facing enterprises is that existing search models require you to take all of this data that you don’t know is valuable or not, move it into one place, and then make decisions about whether this is valuable?

Machine Learning at Splunk in Just a Few Clicks

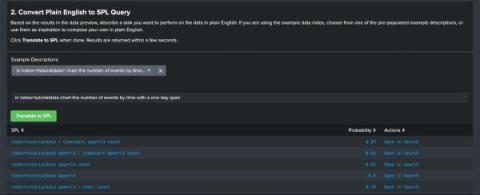
The Machine Learning team at Splunk has been hard at work over the last several months preparing for a few exciting launches at.conf22, held just a few weeks ago. Splunk customers want to leverage machine learning (ML) in their environments, but many aren’t sure how to use it, or even how to get started.

Three Critical Questions for Healthcare

Before the pandemic, healthcare was already experiencing staffing shortages. The patient population was getting older and needing more care. Many healthcare professionals were also heading towards retirement. Unhealthy lifestyles were spreading, and the level of education required to enter healthcare professions was rising. Demand exceeded supply.

Top 7 Java Performance Metrics to Monitor

Today, almost any metric you can think of can be tracked down and reported, as opposed to the past when the software was traditionally provided in boxes and its performance in production could not be predicted. The issues we are currently facing are not due to a lack of information, but rather to an abundance and scale of information. This becomes significantly more difficult to manage when dozens or even hundreds of servers are in use.

A to Z With Observability and OpenTelemetry

How do you go from A to Z with observability and OpenTelemetry? This post answers a question we hear often: “How do I get started on instrumentation with OpenTelemetry, while also following best practices for the long-term?” This article is all about taking you from A to Z on instrumentation. This will help you: We will use a simple greeting service application written in Node.js to understand the journey. You can find the pre-instrumented state here.

The 5 Ws (and 1H) of InfluxDB Edge Data Replication

As more businesses generate and process data at the edge, the need to share data from edge nodes to a centralized cloud location increases. Replicating data from the edge to the cloud ensures consistency across an entire application and creates an uninterrupted historical record that preserves the critical context of time. Edge Data Replication (EDR) is a feature available in InfluxDB designed to address this challenge.

The Return of the InfluxDB V1 Shell

The community has spoken and the demand was clear: “BRING BACK THE INTERACTIVE SHELL USED IN 1.X” So it’s back… It works with InfluxDB V2… and has some improvements. The interactive shell allowed users to write data and interactively query data using InfluxQL. For newer users, InfluxQL is the SQL-like query engine that was native to the first major version of InfluxDB.

How to Monitor Varnish with Google Cloud Platform

We’re excited to announce that we’ve recently added Varnish monitoring support for Google Cloud Platform. You can check it out here! Below are steps to get up and running quickly with observIQ’s Google Cloud Platform integrations, and monitor metrics and logs from Varnish in your Google Cloud Platform.

Introducing Kubernetes Monitoring in Grafana Cloud

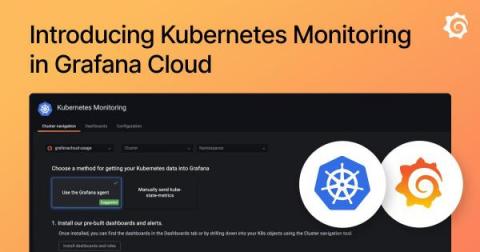
Kubernetes has quickly become the standard container orchestration technology for developers and companies who want to deploy at scale, iterate quickly, and manage a large number of applications and services. At Grafana Labs, we recognized the need for something more powerful for our users to be able to successfully keep an eye on everything happening inside their clusters.