The latest News and Information on Monitoring for Websites, Applications, APIs, Infrastructure, and other technologies.
Scripted Configuration of the NiCE VMware Management Pack provides a semi-automated means of setting up VMware monitoring administration with the help of approved and tested script functions. The NiCE Development Team has put together a new technical white paper for you to use automated administration easily.
2023 is well underway and now more than ever it’s important to stay ahead of data trends and security concerns that are ever mounting. With the cost of catastrophic cyber attacks estimated to be ten times that of all other disasters combined, businesses need to take proactive measures to implement a security data pipeline to protect their data and comply with security and retention requirements.
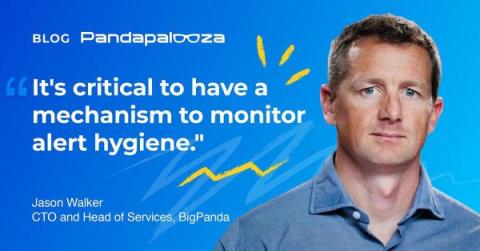
Most organizations suffer from some form of alert noise, shares Adam Blau, senior director of product marketing at BigPanda. “Alert noise is only going to increase as organizations support cloud-native applications spanning multiple public and private clouds, including ephemeral deployments and more. It’s not going to get easier for organizations to understand the signal from all those alerts being sent,” Blau said.
Prometheus is a powerful open-source monitoring system that can collect metrics from various sources and store them in a time-series database. It is widely used in the industry to monitor and alert the health of applications, servers, and other infrastructure components. In this article, we will provide a practical introduction to Prometheus monitoring and cover the essential concepts and features that you need to know to get started.
At Sentry, we practice continuous delivery, which means that code can be released as soon as it’s merged into the main branch. This allows us to iterate quickly on our product, making new features, bug fixes, configuration changes, and experiments available in production as frequently as possible. We merge over 700 pull requests a month.