How to Use WhatsUp Gold Device Groups
A brief training video on the different types of device groups (static, dynamic and WUG) in Progress WhatsUp Gold and how to use them to simplify your monitoring tasks.


The latest News and Information on Monitoring for Websites, Applications, APIs, Infrastructure, and other technologies.
Today’s enterprises must have the capability to cope with the growing volumes of observability data, including metrics, logs, and traces. This data is a critical asset for IT operations, site reliability engineers (SREs), and security teams that are responsible for maintaining the performance and protection of data and infrastructure. As systems become more complex, the ability to effectively manage and analyze observability data becomes increasingly important.
It’s been a minute since our last Feature Focus, and we have a bit of catching up to do! I’m happy to report we’ll resume monthly updates next month, but until then, please enjoy this super-sized winter digest of what we’ve been up to at Honeycomb.
If you’ve been keeping a close eye on the RapidSpike platform, you’ll know that in the past few months, we’ve released a bunch of really useful website monitoring features and upgrades that make using the platform even more intuitive. Learn about the new Setup Wizard and our other new features below.
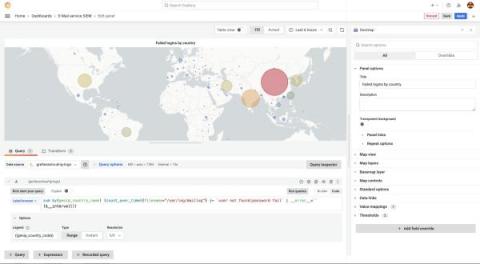
Legacy systems often present a challenge when you try to integrate them with modern monitoring tools, especially when they generate log files that contain personally identifiable information (PII) and IP addresses. Thankfully, Grafana Cloud, which is built to work with modern observability tools and data sources, makes it easy to monitor your legacy environments too.
Observability is a critical step for digital transformation and cloud journeys. Any enterprise building applications and delivering them to customers is on the hook to keep those applications running smoothly to ensure seamless digital experiences. To gain visibility into a system’s health and performance, there is no real alternative to observability. The stakes are high for getting observability right — poor digital experiences can damage reputations and prevent revenue generation.
Are you ready to put on your detective hat and become a master network sleuth? We rely on our network to be the backbone of our businesses. From your Internet, to your VPN, to running VoIP and Unified Communication applications (like Zoom), networks have large responsibilities. But how can you know if your network is performing as it should be? That’s when you perform a network assessment.