Version 4.3 is packed with upgrades to enhance data center monitoring. Improvements in Connectivity, Alarm Event Management, and Notifications aim to boost your experience, offering customizable alarm settings, reducing email volume, and integrating seamlessly with MS Teams for alerts.
Today, many companies generate and store huge amounts of data. To give you an idea, decades ago, the size of the Internet was measured in Terabytes (TB) and now it is measured in Zettabytes (ZB). Relational databases were designed to meet the storage and information management needs of the time. Today we have a new scenario where social networks, IoT devices and Edge Computing generate millions of unstructured and highly variable data.
CPU utilization is a crucial metric for measuring system performance and identifying potential bottlenecks in Linux systems. This article explores the concept of CPU utilization, factors contributing to high CPU usage, and various command-line tools and graphical utilities for monitoring and troubleshooting CPU utilization in Linux environments.
Rootly On-Call streamlines incident management with automated scheduling, noise reduction, and centralized documentation. It mitigates on-call fatigue with features like flexible overrides, shift visibility, and shadow rotations, enhancing team well-being and preventing burnout.
One of the real successes of the Agile Software development movement has been the push to have regular, frequent deployments. This has manifested as build and deployment automation and the general adoption of CI/CD. As engineers automate more processes of their software release lifecycle, an important question is how to automate Quality Assurance, which includes resilience testing and, more specifically, Fault Injection.
Real User Monitoring (RUM) is a type of performance monitoring that involves tracking and analyzing user interactions with a website or web application in real-time. RUM provides valuable insights into how users experience a website or an application by collecting data directly from their browsers and devices during these interactions. Unlike traditional performance monitoring methods that focus on server-side metrics, RUM provides real-time insights into actual user behaviors.
In this post, we delve into the comparative analysis of the commercial offerings of five leading monitoring solutions—Dynatrace, Datadog, Instana, Grafana, and Netdata. Our objective is to unravel the intrinsic value each of these services offers when applied to a real-world scenario.
Effectively managing the dynamics of domain name lookups through the DNS is crucial for boosting the speed and security of network connections. Forward and reverse DNS lookups, the yin and yang of network connections, translate human-friendly domain names into machine-readable IP addresses and vice versa, ensuring secure connections within both public and private networks.
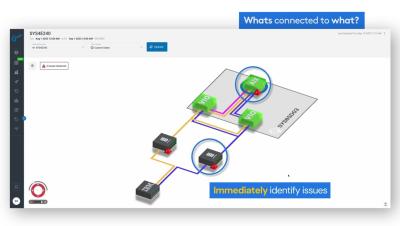
See the complete picture. Galileo’s dynamic asset correlation allows you to navigate from an individual AIX LPAR to the Storage and SAN (or vice versa) to quickly identify the source of any issues and what is impacted.