|
By Nikhil Ravindran
One of the most common questions we receive is about the difference between Aiden (our DevOps Copilot) and general-purpose AI tools like ChatGPT. The key distinction is that Aiden is an agentic AI platform that can directly connect to your DevOps tools and environments, while ChatGPT remains generic without real-world connections. This fundamental difference transforms Aiden from an advisor to an active participant in your DevOps workflows.
|
By Nikhil Ravindran
Looking to enhance automation, optimize your CI/CD pipeline, and improve infrastructure management all at the same time? Look no further than a Agentic AI based copilot. But choosing the right one requires a thoughtful, case-driven approach. From managing the costs associated with using large AI models to ensuring your copilot of choice actually delivers factual and reliable insights, it’s important to have all the information you need..
Software development has evolved into a complex symphony of tools, platforms, and processes. While each new tool promises to solve specific challenges, together they’ve created an unexpected burden on development teams. The very solutions meant to streamline our work have paradoxically become a source of friction. A shocking stat from Gartner reveals the scale of this crisis: developers spend only 10-25% of their time actually writing code.
|
By Nikhil Ravindran
As the demands of modern software development continue to grow, so too does the complexity of DevOps. To keep pace, many organizations are turning to AI-powered assistants that help manage infrastructures, streamline pipelines, and automate repetitive tasks. These assistants are known as copilots, and they promise to enhance productivity while reducing operational overhead. But not all of them are created equal.
|
By Nikhil Ravindran
In today’s fast-paced software product development world, efficiency and innovation aren’t just important — they’re everything. DevOps engineers and SREs are tasked with maintaining high-performing systems, improving deployment frequency, and ensuring stability while navigating a dizzying amount of tools. Developers who write code also need to learn these tools and are dependent on them to do their jobs. So what’s the problem?
|
By Divyarthini Rajender
When it comes to monitoring, diagnosing, and optimizing the performance of complex systems today, you can’t really go wrong with tracing tools. And while OpenTelemetry has become the go-to choice for instrumenting apps and collecting traces, there are several other options in the backend that can effectively store, manage, and analyze traces sent by OpenTelemetry. Two of these open-source tools are Jaeger and Grafana Tempo. In this article, we’ll compare and contrast the two.
|
By Divyarthini Rajender
With the increasing complexity of modern applications, log management solutions have become synonymous with troubleshooting, monitoring, and ensuring application reliability. Moreover, choosing the right tools can significantly impact your application’s performance, efficiency, and overall operational costs. Two powerful tools that often come up in these discussions are Grafana Loki and the ELK Stack (consisting of Elasticsearch, Logstash, and Kibana).
|
By Divyarthini Rajender
For any digital business today, keeping applications running smoothly and efficiently is a no-brainer. Application Performance Monitoring (APM) is an invaluable process in that regard, helping teams track the performance and health of their software applications. APM involves the use of tools and practices to detect, diagnose, and resolve performance issues in real-time, thereby ensuring optimal user experiences.
|
By Divyarthini Rajender
ObserveNow, the leading open source-based observability stack, has recently enhanced its capabilities with the introduction of Span Filtering – a key feature in its latest upgrade to Grafana 10.4. This advancement significantly improves the platform’s ability to dissect and analyze traces, which are crucial for understanding the behavior and performance of distributed systems.
|
By Divyarthini Rajender
There’s no doubt about it: Internal Developer Portals (IDPs) are transforming the way organizations manage their development processes. Gartner defines an IDP as a tool designed to facilitate self-service discovery, automation, and access to various resources within modern software development environments. IDPs are bound to become the backbone of many engineering teams today, and the essential features that engineers seek in an IDP can significantly impact its overall effectiveness.
|
By OpsVerse
Aiden Vs Chat GPT AWS Cost Analysis Use Case.
|
By OpsVerse
40% of Kubernetes clusters were affected. The NGINX Ingress vulnerability (CVE-2025-1974) shook the DevOps world recently. But what if fixing it was as simple as…… Asking?
|
By OpsVerse
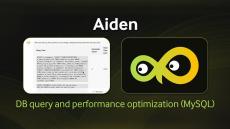
DB query and performance optimization MySQL.
|
By OpsVerse
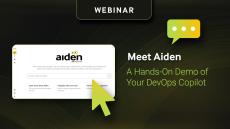
Discover how Aiden, the world's first DevOps Copilot, can revolutionize your DevOps workflows. This session provides an in-depth look at Aiden's capabilities and demonstrates how it simplifies complex DevOps processes. Key Takeaways: Follow OpsVerse on.
|
By OpsVerse
A few days ago, we announced the public launch of Aiden 2.0, and now it’s time to show you what Aiden is capable of.. Agenda: This webinar is perfect for: Don’t miss this insightful session!
|
By OpsVerse
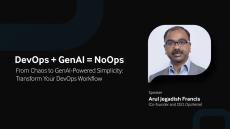
Spend on the Signals, Not on the Noise: Cost-Conscious Observability 101: Smartly optimize your observability costs, potentially lowering them to account for less than 20% of your total cloud costs. Learn practical and proven strategies from Navin Pai, Founding Engineer at OpsVerse.
|
By OpsVerse
Use OpsVerse's DevOps Copilot, Aiden, to generate an end-to-end CI/CD pipeline from scratch. Aiden brings the power of generative AI and LLMs to DevOps.
- May 2025 (1)
- April 2025 (5)
- March 2025 (1)
- February 2025 (1)
- January 2025 (1)
- December 2024 (2)
- November 2024 (2)
- August 2024 (1)
- July 2024 (2)
- June 2024 (3)
- May 2024 (5)
- April 2024 (2)
- March 2024 (2)
- April 2023 (2)
- February 2023 (1)
- January 2023 (2)
- December 2022 (3)
OpsVerse brings your DevOps back into balance. All of the control of open source tools – with none of the headaches.
Empowering software companies to focus on their products, not on complicated tools and infrastructure:
- The best of open-source, simplified: OpsVerse offers you a curated collection of powerful, open-source DevOps tools, delivering uncompromising flexibility without the costly preoccupation of managing your toolchain.
- Build more. Waste less: The OpsVerse suite is fully-managed to reduce DevOps complexity, freeing up to 45% of your engineers’ time. We enable teams to focus on product building rather than juggling DevOps tools.
- Full control over data residency: With OpsVerse, you have unparalleled flexibility to run your DevOps tools in any environment. Choose between the cloud, private SaaS, or self-hosting to support your compliance and regulatory needs.
- Get started in minutes, not months: Since OpsVerse is fully-managed, your teams can begin using OpsVerse the same day you sign up. Turn months of setup into operational readiness within a matter of minutes.
- Instantly simplify DevOps complexity: Aiden by OpsVerse is your intelligent DevOps CoPilot, using GenAI to automate operations, enhance productivity, and provide precise, actionable insights across your entire toolchain.
Unlock the power with OpsVerse.


