The latest News and Information on Monitoring for Websites, Applications, APIs, Infrastructure, and other technologies.
Regardless of the SquaredUp product you use, the WebAPI tile is very useful when it comes to connecting to external data sources and showing them in your dashboards. It brings you closer to that single pane of glass dashboarding dream that we all have, which is why it is also one of our most used tiles!
Metrics measuring user engagement on your website are crucial for observability in marketing. Metrics will help marketing departments understand which of your web pages do not provide value for your business. Once known, developers can look at the web page’s technical metrics and determine if updates are required. Typically user engagement statistics, like the average time required to load your page, are stored separately from technical site logs.
For the seasoned user, PromQL confers the ability to analyze metrics and achieve high levels of observability. Unfortunately, PromQL has a reputation among novices for being a tough nut to crack. Fear not! This PromQL tutorial will show you five paths to Prometheus godhood. Using these tricks will allow you to use Prometheus with the throttle wide open.
Hybrid cloud architectures provide the flexibility to utilize both public and cloud environments in the same infrastructure. This enables scalability and power that is easy and cost-effective to leverage. However, an ecosystem containing components with dependencies layered across multiple clouds has its own unique challenges. Adopting a hybrid monitoring strategy doesn’t mean you need to start from scratch, but it does require a shift in focus and some additional considerations.
We surveyed nearly 1,000 developers across the U.S. to uncover key development trends and insights. Today’s businesses are software businesses. If there was any positive in 2020, it’s the power software has to allow us to continue in some “normal” sense. Learn how this survey uncovers how too many companies and their development teams still have a major blind spot when it comes to errors in their code.
Catchpoint makes parenting a saner sport! OK, that’s not the usual use case. But much as I know it sounds crazy, I used Endpoint Monitoring to explain to my 11-year-old gamer that I’m totally innocent. The reason she is having gaming lag and lost connections is not because of her parents’ poor home Wi-Fi or her old PC – and she doesn’t just have to take my word for it. Here, let me explain.
Most of us who work in IT understand the concept of basic monitoring. It is not that it is an irrelevant concept, but rather, it is essential for any infrastructure, either manual, by reading logs and checking machines and services; semi-automated, using custom-made scripts or, the safest and most recommended, using a specific tool such as Pandora FMS to centralize your monitoring. But what is synthetic monitoring? We will see that throughout this article.
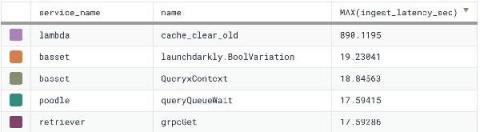
Recently, we added a new derived column function to Honeycomb, INGEST_TIMESTAMP(), which can help customers debug event latency and/or inaccurate timestamps. A meaningful minority of the events sent to Honeycomb are already old when they arrive, and a very special few claim to have been sent from the future. Has this happened to you? Let’s do an experiment.