The latest News and Information on Monitoring for Websites, Applications, APIs, Infrastructure, and other technologies.
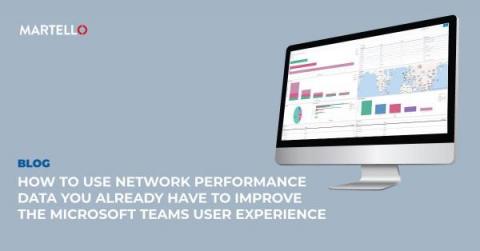
In any organization, the IT operations teams bear the responsibility of providing reliable cloud services to users that are increasingly distributed, working from home, the office, or elsewhere. As a result, IT professionals are looking for solutions to achieve visibility of the user’s network from end to end to quickly identify and resolve bottlenecks and ensure maximum productivity and ROI of their cloud applications.
In today’s world, there’s no lack of monitoring data. In fact, the amount of data DevOps and SRE teams are dealing with on a daily basis can be confusing and overwhelming. Often, the problem is threefold.
A monolithic architecture is one of the oldest architectures used for making software and applications for various companies. In layman's terms, Monolith means everything in a single box. Monolithic software is supposed to be self-contained, and its components are interrelated and interdependent. When it comes to monoliths, updating a single component or rolling out a new feature is difficult. Suppose any program component needs an update.
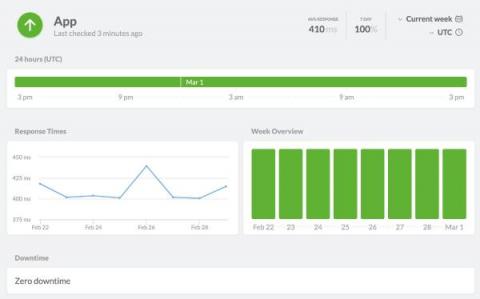
A public status page conveys your service's health and availability to your internal and external users—fostering transparency and trust. We've launched a new status pages feature, adding support for custom domains and branding!
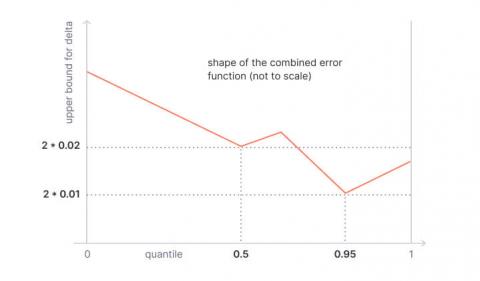
A summary is a metric type in Prometheus that can be used to monitor latencies (or other distributions like request sizes). For example, when you monitor a REST endpoint you can use a summary and configure it to provide the 95th percentile of the latency. If that percentile is 120ms that means that 95% of the calls were faster than 120ms, and 5% were slower. Summary metrics are implemented in the Prometheus client libraries, like client_golang or client_java.
HAProxy is one of the most popular software around when it comes to load balancers and reverse proxies. When you’re using it for these purposes, it’s especially important to monitor for both availability and performance, which will impact your SLI and SLOs. In this post, we’ll talk about the main HAProxy metrics you should monitor and the best monitoring tools you can use to measure them.
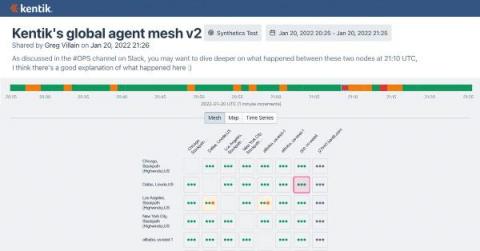
What fun is network observability if you can’t share what you see? That’s why we’ve added public link sharing to the Kentik platform. One of the greater missions of network observability is to break the boundaries of conventional monitoring. At Kentik, we focused our initial efforts on making complex infrastructure problems easy to visualize, understand and resolve. Now we’re tackling a follow-up mandate: to democratize network observability.
On one of the EUC slack forums, a question was recently posted asking what are the key lessons learned in the last year and what changes organizations should investigate in the next year. The answers were revealing. Several folks pointed out that prior to the pandemic, we were operating within the comfort zone of carefully planned deployments with managed devices and managed networks.
Monitor your Oracle databases, instances, tablespaces, pluggable databases, processes, system global area (SGA), clusters, automatic storage management (ASM), listeners, disk groups, and more within minutes. Discover Oracle objects automatically and track the overall health of your Oracle environment easily. Spot and act on Oracle latency issues as they appear. Generate detailed Oracle performance reports with a mouse-click. Use build-in Oracle tasks to speed up operations.