Operations | Monitoring | ITSM | DevOps | Cloud


The latest News and Information on Monitoring for Websites, Applications, APIs, Infrastructure, and other technologies.


3 Simple Ways to Augment Microsoft Call Quality Dashboard Data
The Microsoft Call Quality Dashboard (CQD) does a solid job of helping admins check call and meeting quality across their Teams setup. But wouldn’t it be handy if you could get more out of CQD and make optimizing Teams for your business easier? Here are 3 ways to do just that. Although Microsoft provides the core quality data for you to accurately monitor Teams performance, there are other things you can do to augment your call quality dashboard.

Authors' Cut-Shifting Cultural Gears: How to Show the Business Value of Observability
At Honeycomb, the datastore and query systems that we manage are sociotechnical in nature, meaning the move to observability requires a sociological shift as much as it does a technical one. We've covered the technical part in several prior discussions for our Authors’ Cut series, but the social aspect is a little squishier. Namely: How do you solve the people and culture problems that are necessary in making the shift to adopt observability practices?
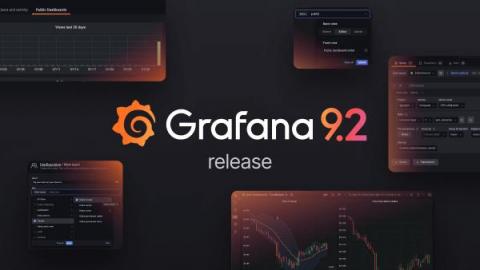
Grafana 9.2 release: New Grafana panel help options, Grafana oauth updates, simplified variable editor for Grafana Loki, and more!
Welcome to Grafana 9.2, a jam-packed minor release with a wide range of improvements to help you create and share Grafana dashboards and alerts. Along with new developments for public dashboards and support for Google Analytics 4 properties, Grafana 9.2 offers new ways to connect with support teams about panel issues, a simplified query variable editor for Grafana Loki, improvements to access control, and much more.
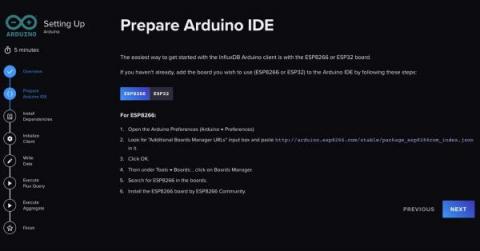
Product Update - Arduino Onboarding Made Easy
We love to write and ship code to help developers bring their ideas and projects to life. That’s why we’re constantly working on improving our product to meet developers where they are, to ensure their happiness, and accelerate Time to Awesome. This week, we are covering a product release that we think will save you time and effort when onboarding to time series and InfluxDB using Arduino.
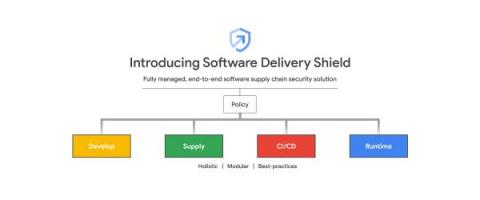
Introducing Software Delivery Shield for end-to-end software supply chain security
Organizations and their software delivery pipelines are continually exposed to growing cyberattack vectors. Coupled with the massive adoption of open source software, which now helps power nearly all of our public infrastructure and is highly prevalent in most proprietary software, businesses around the world are more vulnerable than ever. Today’s organizations need to be more vigilant in protecting their software development infrastructure and processes.

How We Earn It: High Customer Satisfaction
One of the gratifying things about working at Cribl is receiving daily validation that we’re making customers’ lives easier, and solving their real problems. Every time someone tells us something like this, our hearts gladden, and a goat angel gets its wings: Numbers like those also translate into…numbers. When we surveyed customers in our most recent quarter, our CSAT (Customer SATisfaction) score was above 90%.
What's New in Checkly Launch Week
The Checkly development team is continually improving our platform and user experience, and we’re excited to unveil some new features that we’ve been working on during our first ever Checkly Launch Week. From October 11th through 14th, we’ll be announcing and discussing our latest innovations, new features, functionality, and capabilities for users every single day of the week.

Checkly Alerting Improvements and Our New Slack Community
Welcome to day one of our very first Launch Week! In the upcoming days, we’ll release new features every day. We’ll share new alerting capabilities, unlock the power of Playwright, and will talk about new ways to control and write your Browser checks. It’ll be a nice feature and improvements mix, trust me! To kick things off, let’s have a look at what’s new in the world of monitoring and alerting.
How AIOps enhances operational efficiency
Digital data is everywhere, and its sheer volume and ambiguity often make it challenging for us humans to analyze. That’s why we use a special branch of AI called artificial intelligence for IT operations (AIOps) to reveal the deeper structure of copious data. AIOps sits at the intersection of big data and machine learning to improve the efficiency of IT operations.