Announcing DORA metrics for teams
Sleuth is pleased to announce a new set of features that enable our customers to measure, compare, and drive efficiency improvements on a per-team basis!


The latest News and Information on DevOps, CI/CD, Automation and related technologies.
Sleuth is pleased to announce a new set of features that enable our customers to measure, compare, and drive efficiency improvements on a per-team basis!
More and more teams are moving away from monolithic applications and towards microservice-based architectures. As part of this transition, development teams are taking more direct ownership over their applications, including their deployment and operation in production. A major challenge these teams face isn't in getting their code into production (we have containers to thank for that), but in making sure their services are reliable.
Communications are evolving at a dizzying pace, challenging service providers of all stripes to adopt the latest technologies and reshape their businesses for the new world. Telco Cloud, an area my team and I are deeply focused on, is one of the key components in making that transformation a success.
As businesses grow and develop, so must the tools that help manage them. Application monitoring tools provide enterprises with a way to keep track of the health and performance of their applications and ensure that everything is running smoothly. Application monitoring tools have a wide range of capabilities and data that enterprises can use to help answer questions about the current state of an application.
Mature start-ups and scale-ups create wonderful and challenging environments for Engineers. As the product they’re creating matures and the brand becomes a successful one, the user base generally starts growing, and, for some companies, in places they might not expect it to grow. As that happens, new challenges arise for Engineers. One of these challenges is pretty straightforward to guess. Basically having a particular product available throughout different regions of the world.
Kubernetes is an open source platform that, through a central API server, allows controllers to watch and adjust what’s going on. The server interacts with all the nodes to do basic tasks like start containers and pass along specific configuration items such as the URI to the persistent storage that the container requires. But Kubernetes can quickly get complicated. So, let’s look at Vanilla Kubernetes — the nickname for a a K8s setup that’s as basic and elementary as it gets.
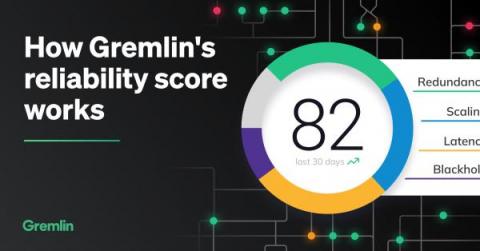
In order to make reliability improvements tangible, there needs to be a way to quantify and track the reliability of systems and services in a meaningful way. This "reliability score" should indicate at a glance how likely a service is to withstand real-world causes of failure without having to wait for an incident to happen first. Gremlin's upcoming feature allows you to do just that.