Operations | Monitoring | ITSM | DevOps | Cloud

The latest News and Information on DevOps, CI/CD, Automation and related technologies.

How to monitor CoreDNS with Datadog

In Part 1 of this series, we introduced you to the key metrics you should be monitoring to ensure that you get optimal performance from CoreDNS running in your Kubernetes clusters. In Part 2, we showed you some tools you can use to monitor CoreDNS. In this post, we’ll show you how you can use Datadog to monitor metrics, logs, and traces from CoreDNS alongside telemetry from the rest of your cluster, including the infrastructure it runs on.


Tools for collecting metrics and logs from CoreDNS

In Part 1 of this series, we looked at key metrics you should monitor to understand the performance of your CoreDNS servers. In this post, we’ll show you how to collect and visualize these metrics. We’ll also explore how CoreDNS logging works and show you how to collect CoreDNS logs to get even deeper visibility into your Deployment.

Key metrics for CoreDNS monitoring

CoreDNS is an open source DNS server that can resolve requests for internet domain names and provide service discovery within a Kubernetes cluster. CoreDNS is the default DNS provider in Kubernetes as of v1.13. Though it can be used independently of Kubernetes, this series will focus on its role in providing Kubernetes service discovery, which simplifies cluster networking by enabling clients to access services using DNS names rather than IP addresses.

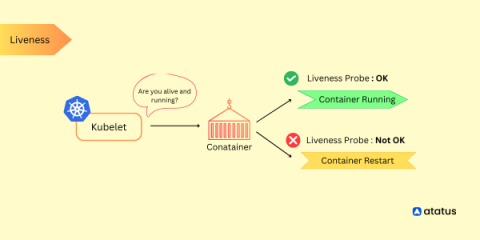
Kubernetes Liveness Probe Guide

Kubernetes liveness probes are a critical component for monitoring the health and availability of application containers running within a Kubernetes cluster. They allow Kubernetes to determine whether a container is running as expected and take appropriate actions if it is found to be unresponsive or in an unhealthy state. Liveness probes periodically check the health of containers by sending requests to a specified endpoint or executing a command within the container.

Announcing In-Place Upgrade from Ubuntu Server to Ubuntu Pro on Azure

We are pleased to share that Azure is now offering an in-place upgrade from Ubuntu Server to Ubuntu Pro. This functionality, made possible through our strategic partnership with Azure, provides a straightforward way to leverage the advanced features and extended security maintenance of Ubuntu Pro, all without redeploying your Virtual Machine (VM) or scheduling a maintenance window.

Ship faster by integrating AI into your Bitbucket workflow

AI tools have taken the world by storm. In April, we announced Atlassian Intelligence to bring the power of AI into our tools. Leveraging AI through internal models and our collaboration with OpenAI, Atlassian Intelligence will be built into the Atlassian suite of tools, including Bitbucket Cloud.

What's missing from your incident management workflow

The first fifteen minutes of an incident set the tone for the rest of the resolution process. But what makes the difference between a rapid response and a stressful scramble—clear ownership—hasn't always been easy to ascertain. In this article, we’ll cover how Cortex, an internal developer portal, can be your team’s source of truth to accelerate the incident management process, and reduce MTTR.

How to record a business process with Kosli's Audit Trail

Have you ever needed to provide proof that a critical business process actually took place? It’s a painful process involving all kinds of paperwork, but it’s the reality for many organizations working in highly regulated industries. For these companies, records need to be kept for actions like the provisioning of user accounts and access to sensitive records. It’s necessary, but it’s manual and time-consuming work.