Operations | Monitoring | ITSM | DevOps | Cloud

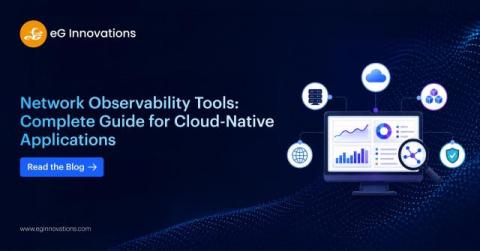
Network Observability Tools: Complete Guide for Cloud-Native Applications

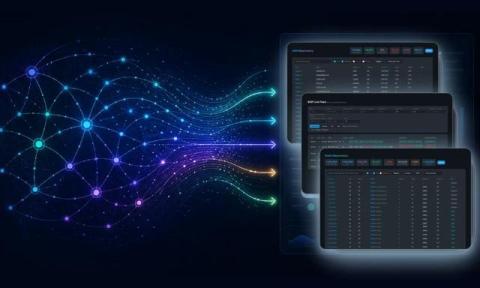
Modern IT ecosystems have undergone a profound transformation. Organizations have shifted from monolithic applications running on static infrastructure to highly distributed, cloud-native environments powered by microservices, containers, and Kubernetes. This shift has unlocked unprecedented scalability and agility, but it has also introduced new layers of complexity that traditional monitoring tools were never designed to handle.
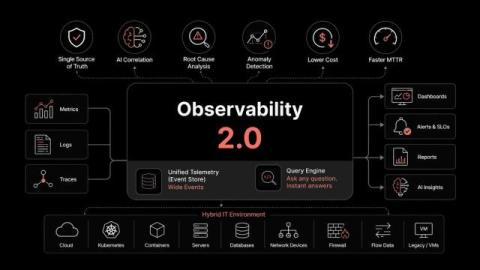
What Is Observability 2.0? Meaning, Key Features, and How to Adopt It

How many tools does your team need to answer one question about production? For most enterprise IT teams the honest count is four: a metrics dashboard, a log analyzer, a tracing tool, and the spreadsheet where someone stitches the other three together during an incident. Each of those tools stores its own copy of the truth and sends its own bill.

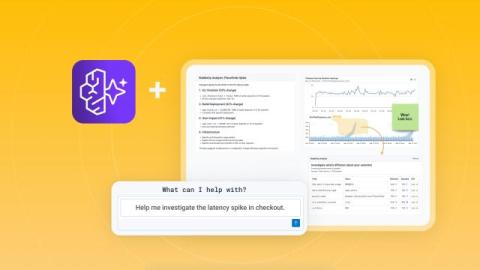
Multi-Agent Collaboration on a Shared Canvas

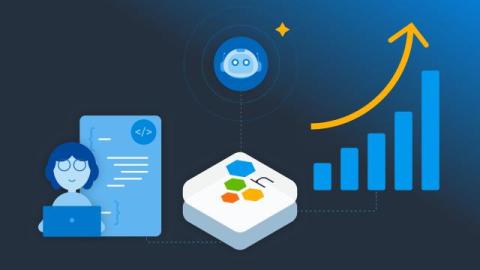
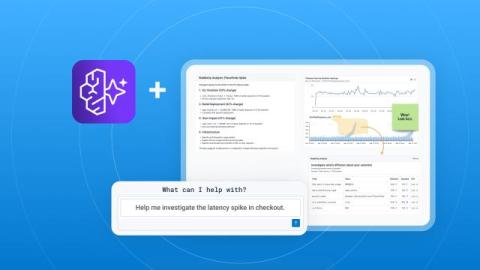
This post was co-written with Staff Software Engineer Martin Holman. Honeycomb Canvas is a collaborative investigation environment. When something goes wrong in production, multiple engineers might join the same Canvas to debug it together. Each person has their own AI agent, so they can pursue their own conversation thread and line of inquiry. This creates an opportunity for coordination.

Deterministic vs Probabilistic AI Engineering Explained

Deterministic processes carry one guarantee: the same input will produce the same output. That guarantee built the entire observability stack. AI broke that contract by reasoning in terms of probability. The same input can now produce different outputs, whether from AI-generated code that carries assumptions invisible in staging, or from distributed systems where timing creates failures that no pre-captured telemetry can anticipate.

Driving Value from Puppet Metrics: Puppet Observability Data Connector

The Puppet Observability Data Connector is a premium Forge module included with Puppet Enterprise Advanced (PEA). This module provides a deeper dive into your Puppet agent reports. Visualizing these metrics gives you a great way to identify what is healthy and unhealthy in your environment.

From Prototype to Production With AWS AgentCore

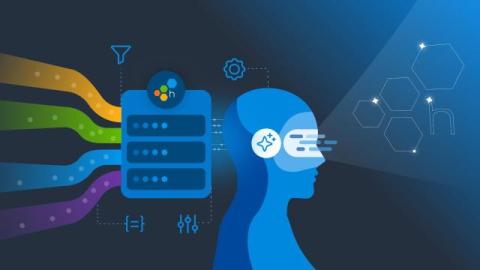
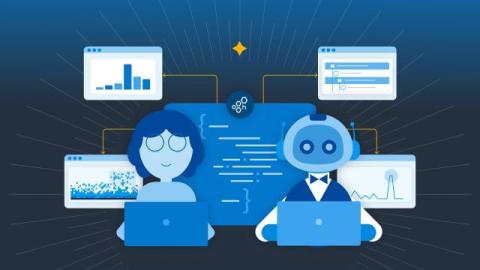
"Hello world, this is your agent speaking!" The agent loop! The LLM is calling tools, the answers are sensible, and the sky's the limit. Now, as you look forward to production, you look for a composable toolset, something that can grow with your use case and system needs. That's what we created with Honeycomb Canvas: a collaborative investigation space where AI agents help you understand, fix, and learn about your system.

Tech Talk: Observability Simplified, APM and Network Behavior

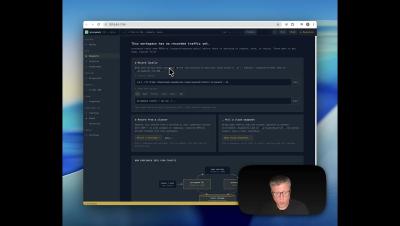
Participants are welcomed to a session titled "Observability Simplified," focusing on user experience, application performance, and network behavior. This second part of a three-part series highlights how the Splunk Observability Cloud and Cisco ThousandEyes can create a unified view of applications, infrastructure, and network performance. Key discussions include addressing siloed troubleshooting, enhancing visibility, and a live demo showcasing how to identify network issues affecting application performance. Attendees are encouraged to participate in the Q&A and are reminded that the session will be recorded for future reference.

Observability for LLM Apps and Agents: OpenLIT SDK + VictoriaMetrics observability stack

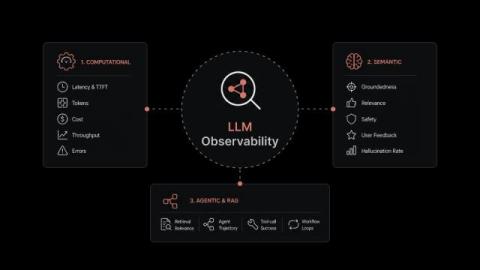
Many “LLM observability with OpenTelemetry” tutorials stop at a single chat.completions span. That works for a demo, but it leaves gaps once an agent fans out into 30 tool calls, two vector-DB queries, three handoffs, and a 90-second tail latency you need to attribute. This post wires the OpenLIT SDK (50+ instrumentations, OTel GenAI semantic conventions, one line of code) into the full VictoriaMetrics observability stack and shows query examples that turn agent telemetry into decisions.

Unified Observability: Moving IT Teams from Reactive to Predictive

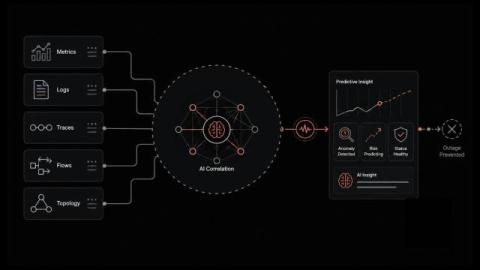
What does it take to stop an outage before it starts? In many cases, the warning signs are already there, scattered across different monitoring tools, which makes it difficult to see the full picture before issues escalate. When an incident occurs, engineers often spend valuable time piecing together metrics, logs, traces, and alerts to determine the root cause. Every minute spent investigating extends the outage and increases its business impact.

How SRE Practices Improve Trust in Digital Finance and Healthcare Platforms

Trust used to be a brand problem. Now it's an uptime problem, a latency problem, a data integrity problem, and sometimes a "why is the payment button spinning again?" problem. For digital finance and healthcare platforms, users don't separate the service from the system behind it. If the app fails, the business feels careless. If records lag, confidence drops. If a transaction disappears for even a few seconds, panic arrives fast.

Could vs. Should: The First Year Managing an SRE Team

As of today, I’ve drafted this post upwards of 10 times – it’s old enough that the version I first started working on was called “Reflections on 1 Year of SRE Management” (I’m currently at 2.5 years). But everything I learned during that first year became critical for the next.

Why Modern IT Incident Response Needs Social Sentiment Analysis

IT operations teams face an ongoing battle against alert fatigue. Despite running sophisticated telemetry and baseline Application Performance Monitoring, engineers are often bombarded with notifications that lead nowhere. Relying purely on internal dashboards creates a massive visibility gap, and when critical incidents slip through the cracks, the financial damage is swift and severe. To close this gap, DevOps professionals are increasingly looking beyond traditional server metrics and turning to a surprising source for early warning signals: public social sentiment.

How AI Agents Are Changing Each Agile SDLC Phase

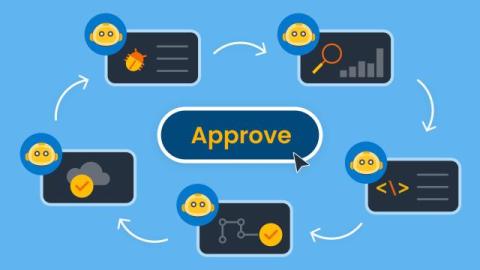
The Agile software development lifecycle was designed to surface problems early, with short sprints, iterative testing, and continuous integration built on the premise that faster feedback loops produce better software. AI coding tools have changed the velocity equation across every phase of that loop, but the phases designed to catch failures are struggling to keep up because build speed and validation capacity have not accelerated at the same rate, and the gap between them is widening with every sprint.