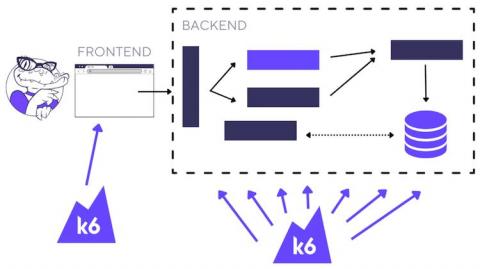
There are many aspects of application performance, but they broadly fall into two categories: frontend performance and backend performance. As a tester, it’s important to know the differences between the two and how that impacts the way you approach your tests. In this blog, I’ll provide a high-level overview of frontend performance testing and backend performance testing, including pros and cons of each one.
Prometheus is an open source and free to use metrics collection and storage solution. It's used extensively in the industry for monitoring many different technologies. In this article I will show you how to get Prometheus up and running as a binary, a container running in Docker, and inside Kubernetes.
Compliance is a term commonly associated with heavily regulated industries such as finance, healthcare, and telecommunication. But in reality, it touches nearly every business today as governments and other regulatory agencies seek to enact tighter controls over the use of our collective digital footprint. As a result, more and more companies need to retain a record of every single digital transaction under their control.
When we introduced Grafana Mimir into the open source ecosystem, we weren’t shy about our ambitions. Once we got past answering some of the easier questions (For the record, the name Mimir comes from Norse mythology, and it’s pronounced /mɪ’mir/.), we quickly got to work making good on our promise to deliver the most scalable, most performant open source time series database (TSDB) in the world.
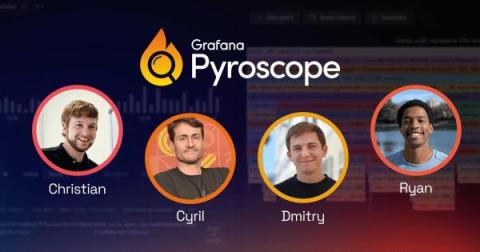
What do you get when you combine the wit, wisdom, and weird humor of four talented tech minds? As it turns out, a surprisingly lively Q&A! As Grafana Pyroscope emerges from the union of Grafana Phlare and Pyroscope, it’s time to really get to know the people behind these continuous profiling projects. That’s why we brought together the Pyroscope founders, Dmitry Filimonov and Ryan Perry, and Phlare technical leads, Cyril Tovena and Christian Simon, for this light-hearted conversation.