Operations | Monitoring | ITSM | DevOps | Cloud

FortiGate, PAN-OS and Zscaler dashboards: get firewall logs into the fields they read

FortiGate, PAN-OS and Zscaler now each have a six-dashboard pack in the Dashboard Library, live on every Logs stack. If your firewall logs already arrive as parsed module fields, the Library pre-selects the matching pack. If they don't, it won't, even when the firewall has been sending syslog for years. This post is about that gap: which parsed fields each pack reads, the Filebeat module settings that produce them, and the API checks that tell you whether the dashboards will fill before you install them.

Grafana 13.3 release: manage variables across dashboards, share findings with Notebooks, a UI refresh, and more

Grafana 13.3 is here, bringing more consistency and control to how you work across Grafana. Cross-dashboard variables help you manage shared dashboard controls from one place, while Notebooks let you capture and share findings from across Grafana in a single, editable document. You'll also get a first look at Grafana's biggest visual refresh since Grafana 7, along with new ways to guide and refine dashboards built with Grafana Assistant.
Featured Post

We've Never Shipped Code This Fast. Understanding It Hasn't Kept Up.

Ask anyone where dev ends and ops begins and they'll struggle to draw the line. That's the point of the last decade of DevOps: the two disciplines merged so completely that the boundary stopped mattering. But ask where building ends and understanding begins, and everyone answers instantly. Right after deploy.

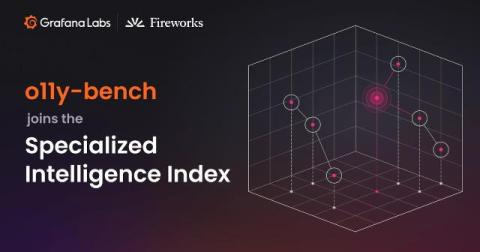
Evaluate AI models for observability: o11y-bench joins Fireworks' Specialized Intelligence Index and reaches v1.1

When evaluating AI models for observability, generating a plausible query or explanation isn't enough. Teams need to know whether an agent's conclusions are supported by telemetry, whether its changes to dashboards actually work, and whether it can deliver reliable results consistently. This is why we built o11y-bench, Grafana Labs' open benchmark for evaluating AI models on observability and SRE tasks. And today, we're excited to share two updates.

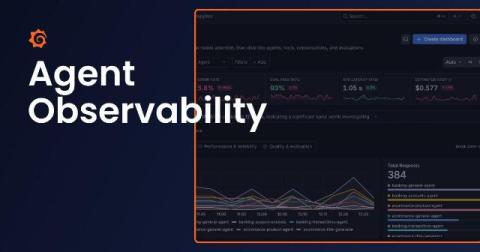
Agent Observability FAQ: Understand the value of monitoring, evaluating, and improving your AI agents

Agents have quickly become part of the tech landscape as organizations embrace AI across their businesses. But embracing agents also means embracing the monitoring best practices that have long been part of engineers' workflows: tracking performance, catching errors, and responding to incidents But it doesn't stop there. Agents also introduce new challenges.

Grafana Campfire - What's New in Table & Text Panel - (Grafana Community Call - Oct 2026)

Join us for a Grafana Campfire on the New Text and Table panels. See how the redesigned Text editor lets you write and preview side by side, and how Handlebars templates, value mappings, thresholds and Mermaid diagrams turn your query results into rich, data-driven content. Then we’ll look at Table’s new ad hoc interactions (hide, filter and group, right in the table) and a first look at how Table works with Grafana Assistant.

Create Custom Visualizations | Introducing Grafana Pages | New from Grafana AI

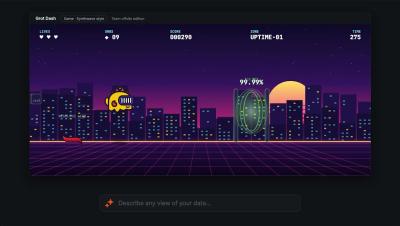
Grafana Pages is now in public preview in Grafana Cloud. Tell Assistant what you want it to see , and Pages builds it: a custom visualization, an app, a slide deck, or even a game. Pages are for the moments a dashboard can’t cover, like walking leadership through a launch, starting your day with a view of the services you own, or turning an incident into a story everyone can follow.

Managing Collectors at Scale: OpAMP and Fleet Management (Grafana OTel Community Call #11)

In this episode of the Grafana OTel Community Call, we're joined by Bejal Lewis and Paschalis Tsilias from Grafana Labs to talk about OpAMP, the Open Agent Management Protocol, and what it takes to manage OpenTelemetry Collectors at scale. We'll cover what OpAMP is and why fleet management matters, where the spec stands today (it's still pre-release), and what it was like building production tooling on top of it.

Spend less time on operational busywork and resolve incidents faster with Grafana Workflows

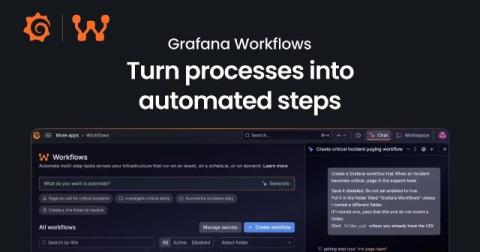
You're investigating checkout errors when someone asks who's coordinating the incident. Support needs an update, and another responder is looking for the runbook. You stop what you're doing to get everyone pointed in the same direction. They're all reasonable requests, but each one takes your attention away from understanding the problem. Yes, your team has a process for handling incidents, but carrying it out is another job for someone who's already busy.

From production problem to proposed fix: Implement autonomous operations with Grafana AI

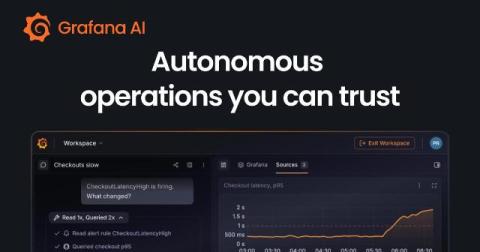
You've just finished a deployment, and though your service is up, you start to notice some requests are getting slower. To address the lag, someone—or, more likely, some group of people on your team—needs to watch the dashboards, decide whether the change matters, investigate what happened, and turn the findings into a fix. At each step you're gathering context—and often explaining that context again to the next person or tool.

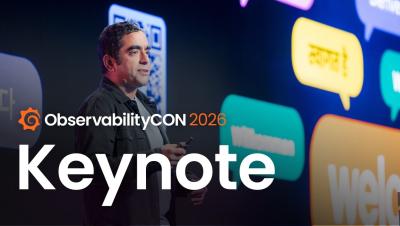
ObservabilityCON 2026: A guide to all the announcements from Grafana Labs

Today at ObservabilityCON 2026 in San Francisco, we unveiled a range of new Grafana Cloud capabilities designed to reshape cloud economics, bring richer context and deeper visibility across your systems and end-user experiences, and help teams move toward autonomous operations. Check out the keynote to learn more about the latest updates to the open agentic observability cloud, and read on for a quick recap of all the news from ObservabilityCON 2026.

Expand what's possible with Grafana: The Grafana Marketplace is now generally available

Earlier this year, we launched the Grafana Marketplace, a platform that gives independent software vendors, systems integrators, and developers in the Grafana community a new way to sell and distribute plugins built for Grafana. The Marketplace builds on our existing plugin catalog by enabling third-party partners and developers to earn revenue from their plugins and invest further in their development.

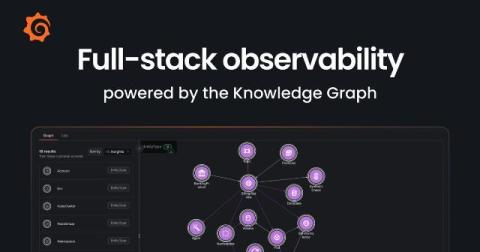
Full-stack observability in Grafana Cloud: More connections, richer context, and faster investigations for users and agents

Most teams have telemetry from across their stack, but connecting those signals to understand what's happening and how it affects users isn't always easy. Critical context about service dependencies, ownership, and past incidents often lives across tools, runbooks, and conversations between team members. That’s why, today at ObservabilityCON 2026, we’re announcing new capabilities that advance full-stack observability across Grafana Cloud.

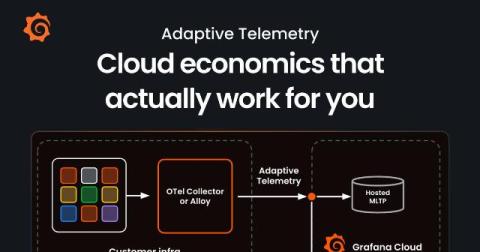
Break the link between data volume and your observability bill with Adaptive Telemetry

In the AI era, where telemetry is generated by every model call, tool invocation, and agent step, organizations need more help than ever when it comes to navigating the economics of observability. For a lot of teams, the default response is a "data diet" of shorter retention, which leaves services or environments out of collection, or basic sampling, which is more guesswork than strategy. Either way, you end up cutting to control the bill, and you risk losing the very data you need during an incident.

Grafana Pages: Turn data into interactive experiences with the next evolution of Grafana

Teams often spend as much time preparing information as discussing it: gathering charts, checking business reports, and finding the GitHub activity that explains a change. Every follow-up question can lead to yet another round of work. That's why, as part of ObservabilityCON 2026, we're excited to introduce Grafana Pages, a new feature in Grafana Cloud that gives you a canvas to describe what you need and build a live app in minutes, based on your real data, context, and interactions.

6 improvements that make Grafana Assistant better at helping your workflows

When you ask Grafana Assistant to build a dashboard or investigate an alert, you're doing so because there's work to be done. To do that work effectively, you need the right data, changes you can inspect, and conclusions supported by evidence. You also want Assistant to avoid mistakes and act quickly. Over the past six months, our team has worked hard to improve what makes those outcomes possible.

Get observability in your pocket with the Grafana mobile app

When you’re on the go, your phone is often the only observability tool you have. And what you can do with it in the first few minutes matters. With the incredible innovation that has gone into mobile CPUs, GPUs and displays, a phone is a powerful device where you can immediately see what’s happening and start acting on it. And the Grafana mobile app now allows you to both see and act.


Coverage-first or cost-first: two ways to automatically apply Adaptive Metrics' recommendations

Adaptive Metrics , which is part of the Adaptive Telemetry suite, looks at how your metrics are actually used and recommends how much detail you should keep for each metric. This helps you cut costs while still retaining the data you actually need. Last year we added auto-apply capabilities that let you implement those recommendations automatically, but only with coverage-first behavior, maximizing coverage of whatever you're querying.

Introduction to Digital Experience Monitoring with Grafana Cloud

Digital Experience Monitoring (DEM) in Grafana Cloud combines frontend observability, synthetic checks, and session replays with backend telemetry to give engineering teams an end-to-end view of customer experience. In this video, Senior Developer Advocate Marie Cruz gives an overview of DEM and a deep-dive demo of how it works in Grafana Cloud.

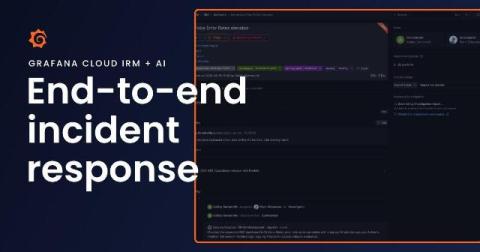
Go from alert to post-incident review with Grafana Cloud IRM and AI

You’ve got 10 minutes before your next meeting when your phone starts ringing. You’re being paged because the frontend is erroring with failed API requests. You open one tool to see what fired, then another to figure out what’s going on. You message a teammate in Slack to see if they’re noticing the same thing. That’s a lot of context switching, and it’s still how a lot of teams' incident response works today. Opening another tool and catching someone up takes time.

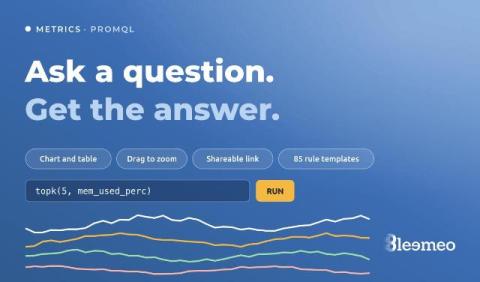
When you have a question, not a dashboard to build: the Metrics explorer and recording rule templates

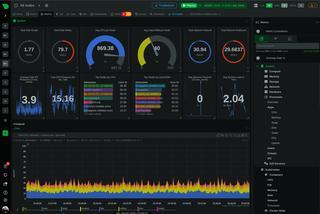
Dashboards answer the questions you knew you would ask. The other kind — “is it only this server, or all of them?”, “since when?”, “what does memory look like on the ones that restarted?” — used to start with creating a dashboard, adding a widget, picking a metric, and deleting the whole thing afterwards. Bleemeo now has a page for those questions. It is called Metrics: you write a PromQL query, run it, and look at the answer.

Landing on the Moon with Grafana and Thermal Engineering | Grafana Everywhere

In honor of World Space Week, we're spotlighting Jackson Sweeney's story and his role in Blue Ghost Mission 1. As a Thermal Engineer at Firefly Aerospace, he used Grafana to ensure that the spacecraft maintained the right temperature throughout the mission... and receive a Golden Grot Award for his use case. Behind every successful moonshot are people solving one hard problem after another. For engineers like Jackson, that means turning an extraordinary ambition into thousands of practical decisions.

Grafana Tempo: Redaction by query & TraceQL filtering in trace-by-ID v2 (Oct 2026 Community Call)

Trace redaction permanently removes sensitive data from your traces, for when something like an API key ends up in a span attribute. Tempo 3.0 could do it, but only from a list of trace IDs, so you had to go find every affected trace first. In Tempo 3.1 you can hand it a TraceQL query instead. Separately, trace-by-ID got a filter. You normally ask for a trace and get all of it. Now you can pass a TraceQL query and get back only the spans that match.

Manage your OpenTelemetry Collectors with Fleet Management in Grafana Cloud

If you’ve built your telemetry pipelines around OpenTelemetry Collectors, you’ve already invested in a collector distribution, YAML configuration, and a deployment model that fits your infrastructure. As that deployment grows, managing it means keeping shared configuration consistent, accommodating different workloads, and understanding whether your collectors are healthy. Fleet Management in Grafana Cloud brings those tasks together in one place.

Manage synthetic checks at scale: Introducing folders in Grafana Cloud Synthetic Monitoring

As your use of Grafana Cloud Synthetic Monitoring grows, so does the number of checks you need to manage across services, environments, and teams. Eventually, a single flat list of checks becomes difficult to navigate, and even simple questions get harder to answer: Which checks belong to the payments team? Can I disable everything in staging during a maintenance window? Who should be able to edit the checks for this service?

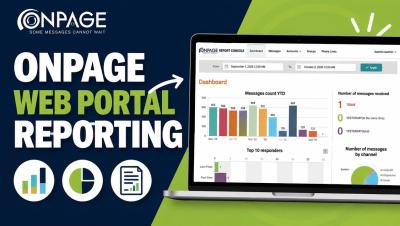
OnPage Web Portal Reporting: Dashboard & Analytics Guide

Learn how to navigate the OnPage Web Portal Reporting Console and gain greater visibility into your organization’s critical messaging activity. In this video, we walk through OnPage’s reporting tools and show how administrators can review alert and message activity, delivery and response metrics, responder performance, account and group activity, and communication trends from one centralized dashboard.

Who Built This Dashboard, and Are They Still Here?

You have lived it, no? When production is down, and you have that chart that says something really strange and peculiar, and nobody knows who did it or when. Production is bleeding. There is a spike on screen. And the chart answers everything except the question you actually have: who built this panel, what did they mean by it, and are they still here?

Grafana Mobile to Desktop Companion App

The Grafana Mobile App lets you triage alerts with help from Assistant from your phone. You can declare an incident or trigger an investigation into an incident in order to get more information so that by the time you get to your desktop, everything is ready for you. Grafanistas Ignacio and Florian go through a use case deep dive, demonstrating the value of the Grafana Mobile Companion app by triggering an investigation, talk to Assistant, and have all the data you need to resolve an incident - all from your phone.

The new Civo dashboard is in beta: Try it today

First previewed on stage at Civo Navigate London, the new Civo dashboard is now in beta, and getting to it just got a lot easier. Starting today, you'll see a Try it now banner at the top of your current dashboard at dashboard.civo.com. Click it to head to the new dashboard, sign in with your usual Civo account details, and you're in. You can also go directly to dashboard-manager.civo.com. Look for the Try it now banner in your current dashboard.