Dashboards

On/Off NOC Dashboards with SquaredUp

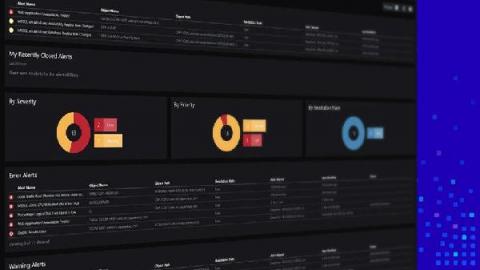
How do you define your workday? You walk into your office, grab a coffee, turn on your laptop and take a look at your central source of information – often dashboards – to glance at things happening overall, tasks assigned to you and sketch your schedule accordingly. A lot of our customers we talk to share a routine like this, and SquaredUp dashboards are often their one-stop-shop for consuming alerts/tasks that need their attention.

Sol1 Releases Meerkat - Next Generation Dashboards for Icinga 2

Meerkat is a lightweight Go and Javascript Icinga 2 client, that connects to the API and displays the status of various checks using elements, like cards, SVGs or images. If you need new users to see at a glance what is important and how it is laid out, Meerkat is the tool for you. It can even play sounds, making for the ultimate sysadmin soundboard! It is quick and easy to setup and use, simply grab the docker container or build from source.

Share Datadog dashboards securely with anyone outside of your organization

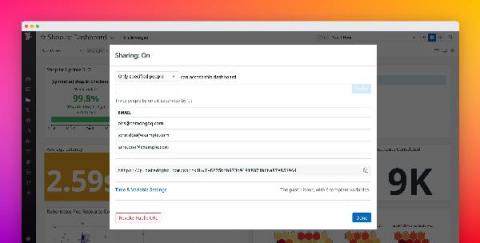
Datadog dashboards provide a unified view of your application, infrastructure, and business data, giving stakeholders the context they need to make decisions. Sharing dashboards publicly is useful when you want to make them easily accessible to a large audience. But oftentimes, your dashboards include sensitive information, which is why you need finer-grained controls over the data you share—and who you share it with.

Dashboards Beta v0.9: All Things Inputs

If you’re new to the Splunk Dashboards app (beta) on Splunkbase and you’re trying to get started with building beautiful dashboards, this blog series is a great place to start. The Splunk Dashboards app (beta) brings a new dashboard framework, intended to combine the best of Simple XML and Glass Tables, and provides a friendlier experience for creating and editing dashboards.

Why choose the Connect license for SquaredUp 5.0?

Every enterprise has its arsenal of tech tools to tackle an array of different challenges. Useful, and necessary, but often a pain to monitor. Whatever your data sources, being able to bring all these metrics into a unified dashboard provides valuable context, which in turn helps you identify and correlate problems more quickly, resulting in improved reaction time and decision making.

Why Grafana Labs delivers the best Prometheus in the Cloud

Over the last several months, there have been a variety of service providers that have launched Managed Prometheus offerings. This is a testament to the rise in popularity of the Prometheus project, and how it’s becoming a de facto standard for metrics. The most recent announcement in the Managed Prometheus landscape came from AWS. During a re:Invent keynote on Dec. 15, Amazon announced its AWS Managed Service for Prometheus.

New and improved Web API tile with SquaredUp 5.0

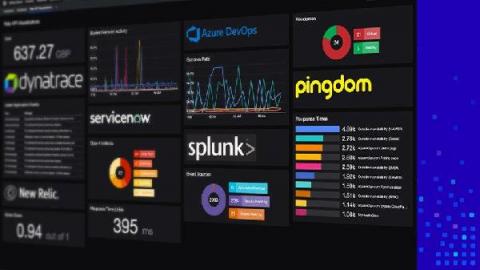
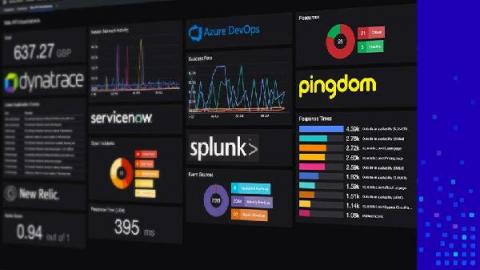
Being able to visualize data from all of your tools in a unified dashboard experience has become critical to most enterprises today. With SquaredUp dashboards, you can not only correlate data from SCOM and Azure, but also surface critical information from your other tools and data sources – including ServiceNow, Azure Log Analytics, App Insights, all SQL databases and any Web API. In short, you can get unified dashboards with real-time operational intelligence for all teams across all tools.