Dashboards
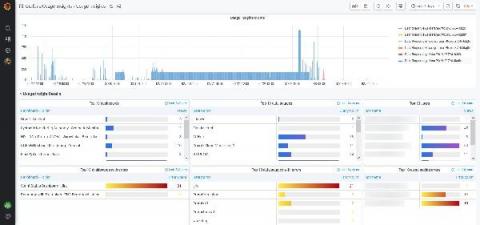
New in Grafana 7.4: Export usage data to Loki to help manage dashboard sprawl and troubleshoot faster
We first released the usage insights Enterprise feature in Grafana 7.0 based on feedback from customers that they would like to better understand how their users are interacting with Grafana, including the dashboards they visit, the information they query, and where they run into issues. What we learned was that dashboard sprawl is a real issue: Administrators estimate that almost 60% of dashboards might not be used at all.
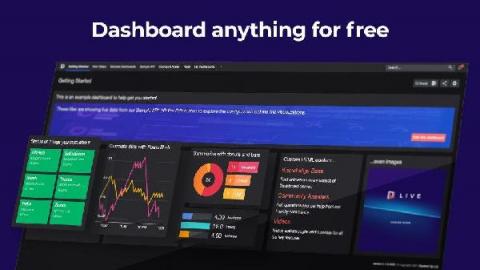
Dashboard anything for free: SquaredUp Dashboard Server Public preview available now
How would your IT team be transformed if you could dashboard anything, for free? If you’re an IT pro and want an enterprise dashboarding tool that’s quick to implement, easy to set up, and effortless to maintain, you need SquaredUp Dashboard Server! The public preview of SquaredUp Dashboard Server just went live! Dashboard Server functions independently of SCOM and Azure and introduces a new PowerShell tile to take dashboarding a big step further. Now you can dashboard virtually any data.
Post-event review: SCOMathon Workshop Week
A couple months ago, we hosted a week of community-led SCOM workshops and networking. These hands-on workshops took a deep dive into a series of topics handpicked by the SCOM community itself – and we are thrilled that the community found it valuable, as we learned from our post-event survey.
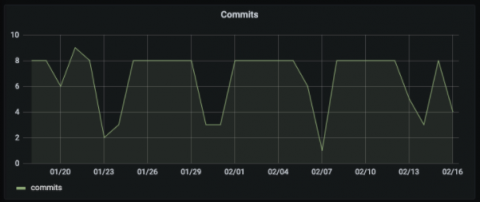
Troubleshoot problems using GitLab activity data with the new plugin for Grafana
GitLab is one of the most popular web-based DevOps life-cycle tools in the world, used by millions as a Git-repository manager and for issue tracking, continuous integration, and deployment purposes. Today, we’re pleased to announce the first beta release of the GitLab data source plugin, which is intended to help users find interesting insights from their GitLab activity data.
How to embed Grafana visualization in SquaredUp
In our previous post on Grafana and SquaredUp, we compared the two tools across various benchmarks like ease of deployment, time to value, dashboard creation, dashboard sharing, and more. Both tools have their specific advantages over the other, but since the ultimate goal is to give you a single place to look – why not leverage Grafana for the visualizations and data sources it offers, but give them meaning by embedding them in SquaredUp?
You should know about... transformations in Grafana
Transformations were introduced in Grafana v7.0, and I’d like to remind you that you can use them to do some really nifty things with your data. All performed right in the browser! Transformations process the result set of a query before it’s passed on for visualization. They allow you to join separate time series together, do maths across queries, and more. My number one use case is usually doing maths across multiple data sources.
Windows network monitoring made easy with OpManager
Network administrators are responsible for the day-to-day operation of computer networks at organizations of any size and scale. Their primary duty is to manage, monitor, and keep a close watch on the network infrastructure to prevent and minimize downtime. Managing a network includes monitoring all the network components, including Windows devices. In any Windows network, the desktops, servers, virtual servers, and virtual machines (VMs), like Hyper-V, run on the Windows operating system.
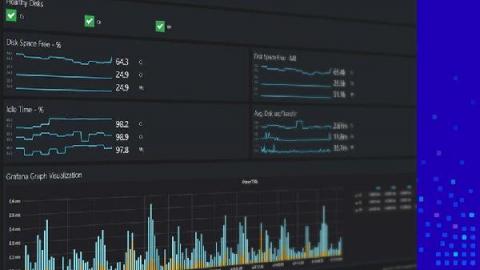
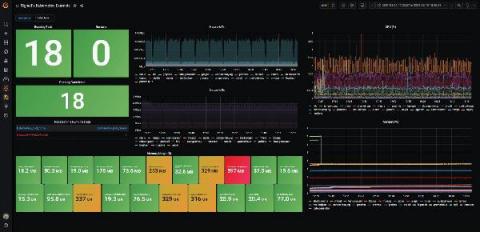
The new Splunk Infrastructure Monitoring plugin brings the SaaS formerly known as SignalFx to your Grafana dashboards
Greetings! This is Mike reporting from the Solutions Engineering team at Grafana Labs. In previous posts, you might have read our beginner’s guide to distributed tracing and how it can help to increase your application’s performance. In this post, we are back to talk about metrics and showcase another one of our newest favorite Enterprise plugins: Splunk Infrastructure Monitoring (formerly known as SignalFx)!

