Dashboards

Why choose the Connect license for SquaredUp 5.0?

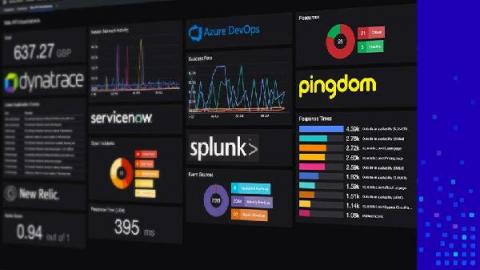
Every enterprise has its arsenal of tech tools to tackle an array of different challenges. Useful, and necessary, but often a pain to monitor. Whatever your data sources, being able to bring all these metrics into a unified dashboard provides valuable context, which in turn helps you identify and correlate problems more quickly, resulting in improved reaction time and decision making.

Why Grafana Labs delivers the best Prometheus in the Cloud

Over the last several months, there have been a variety of service providers that have launched Managed Prometheus offerings. This is a testament to the rise in popularity of the Prometheus project, and how it’s becoming a de facto standard for metrics. The most recent announcement in the Managed Prometheus landscape came from AWS. During a re:Invent keynote on Dec. 15, Amazon announced its AWS Managed Service for Prometheus.

New and improved Web API tile with SquaredUp 5.0

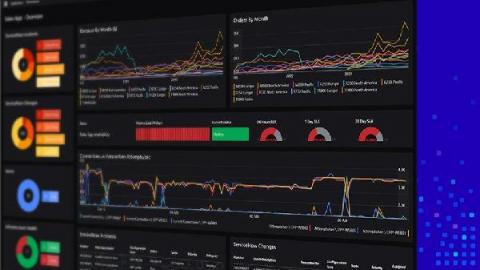
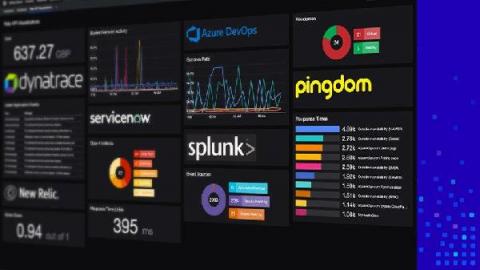
Being able to visualize data from all of your tools in a unified dashboard experience has become critical to most enterprises today. With SquaredUp dashboards, you can not only correlate data from SCOM and Azure, but also surface critical information from your other tools and data sources – including ServiceNow, Azure Log Analytics, App Insights, all SQL databases and any Web API. In short, you can get unified dashboards with real-time operational intelligence for all teams across all tools.

Introducing a new dashboard creation experience in Cloud Monitoring

Having good observability is vital to the health of your cloud infrastructure and applications, and a key element to using that information effectively is being able to create dashboards with relevant metrics. Today we are announcing a new dashboard creation experience from Cloud Monitoring that allows you to generate a greater variety of visualization types, introduces better flexibility for dashboard layouts, and makes data manipulation easier so you can create dashboards that better fit your needs.

New Open Access with SquaredUp 5.0

Our Open Access feature enables easy, and unlimited sharing of dashboards across your organization – with any audience at all. A highly popular feature, these shared dashboards help you bring better visibility and collaboration – conveying the shared “truth”! With our latest release SquaredUp 5.0, we have made Open Access dashboards fully interactive, like the rest of our dashboards, so you can see that next level of detail you’ve been wanting.

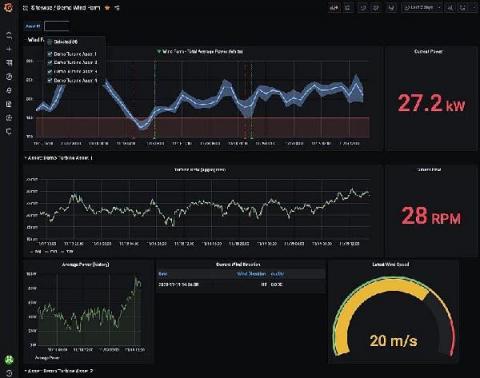
With the new AWS IoT SiteWise plugin, you can visualize and monitor your equipment data in Grafana dashboards

In collaboration with the AWS team, we have just launched another AWS integration, the AWS IoT SiteWise plugin for Grafana. AWS IoT SiteWise is a managed service that helps users collect, store, organize, and monitor data from industrial equipment, across facilities, at scale.

New Magic Dashboard for Ruby on Rails: ActionMailer

Monitoring your application can be a difficult task if you’re just getting started with it. You need to know which metrics matter most and understand which ones you can combine into meaningful graphs. In the (not just holiday ⛄️) spirit of making things smoother for our users, we’ve added a magic dashboard to the Ruby integration that shows you the volume of emails you are sending with ActionMailer.

Improved Dashboard Designer experience with SquaredUp 5.0

At SquaredUp, we are all about dashboards and visualizations that enable you to build the ideal single pane of glass. If you work in monitoring, you know that designing the perfect dashboards that give you all of your important metrics at a glance, is easier said than done. Most of the time, it takes several attempts to optimize a dashboard for easy reading, and more often than not, this step is neglected. I wouldn’t recommend skipping over this step though.

Our new partnership with AWS gives Grafana users more options

At AWS re:Invent today, Dr. Werner Vogels, VP and CTO of Amazon.com, announced a partnership between AWS and Grafana Labs, resulting in the Amazon Managed Service for Grafana, a scalable managed offering that provides AWS customers a native way to run Grafana directly within AWS alongside all their other AWS services. We’d like to give a big thanks to the whole Grafana community. Not only have they inspired us with so many great use cases, but they help us build better software every day.

AWS and Grafana Labs are working together on cloud native observability

Cloud native observability is at a watershed moment. The explosion of microservices has created previously unseen amounts of monitoring data, limiting the ability of humans and computer systems to extract meaning from data with last-generation tools. Debugging is often a process of detecting correlation, and then turning correlations into causal connections. This is where modern cloud native tooling comes in.