Operations | Monitoring | ITSM | DevOps | Cloud

API

The latest News and Information on API Development, Management, Monitoring, and related technologies.

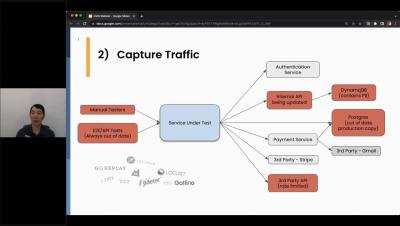
eCommerce Load Testing (Step 2): Capture Traffic

In this webinar clip from "Ensuring performance: How major retailers leverage user traffic to validate code changes", Speedscale Co-founder, Nate Lee, explains what comes next after selecting the business-critical APIs to test first: capturing traffic. Capturing traffic for the service can be done through tools like Speedscale, GoReplay, VCR, K6, and JMeter.

What is an API Gateway?

API Gateways are vital components in today's digital landscape, facilitating seamless communication between systems and applications. To ensure optimal performance, monitoring API Gateways is crucial. MetricFire offers a comprehensive monitoring platform that tracks and analyzes key metrics, providing real-time insights into performance indicators such as latency, error rates, and throughput.

The Darkside of GraphQL

GraphQL is a query language for APIs that provides a powerful and efficient way to query and manipulate data. As powerful and versatile as GraphQL is, its downside is that it can be vulnerable to certain security threats. In this presentation, we will discuss the security vulnerabilities associated with GraphQL, from the basics to more advanced threats, and how to best protect against them. After this presentation, attendees will have a better understanding of security vulnerabilities in GraphQL, as well as an understanding of the steps needed to protect against them.

Ensuring performance: How major retailers leverage user traffic to validate code changes

As featured on CMG.org: Software development and testing is ultimately all in preparation for go-live. But what if you could predict how your go-live could go wrong? In this webinar, learn how traffic-based tests and mocks can accurately simulate peak load conditions, ensure performance, and increase your top line revenue.

Checkly Advances Monitoring as Code with New User-Centric Features

Checkly, the leading provider of monitoring solutions powered by a Monitoring as Code (MaC) workflow, has unveiled two groundbreaking features: the Activity Log and Code Exporter. These innovative features not only enhance transparency and simplify the adoption of MaC practices but also mark a significant step forward in Checkly's commitment to advancing the MaC movement, offering users an end-to-end workflow that integrates seamlessly with modern software development practices.

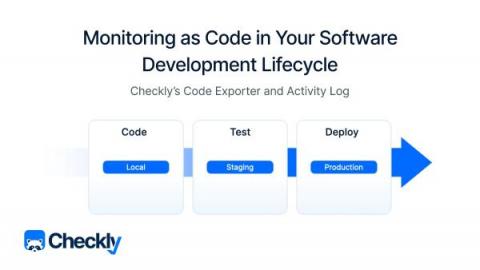
Monitoring as Code in Your Software Development Lifecycle

When we launched the Checkly CLI and Test Sessions last May, I wrote about the three pillars of monitoring as code. Code — write your monitoring checks as code and store them in version control. Test — test your checks against our global infrastructure and record test sessions. Deploy — deploy your checks from your local machine or CI to run them as monitors.

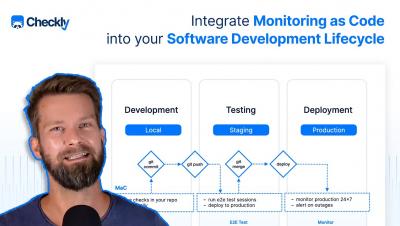
Integrate Monitoring as Code into your Software Development Lifecycle

Learn how the new Checkly features (code exporter and activity log) enable you to integrate Monitoring as Code into your Software Development Lifecycle. Define and debug your monitoring resources during development, test your preview deployments and start monitoring productions with ease.

Synthetic Monitoring: What is it, Challenges, and How to Get Started

With Infrastructure as Code and service-oriented development, a modern web app can consist of countless moving parts developed by multiple development and DevOps teams. When establishing a high-velocity development environment, the main question is, "How can you guarantee a stellar end-user experience when lots of engineers are constantly pushing and deploying code?" Solid, easy-to-write, and clearly defined monitoring practices are the only answer to this question.

How to monitor connector's API Connections in Logic Apps?

Let us consider a scenario where a Logic App is used to communicate with SharePoint through API connections, known as connectors. When configuring the connector, it communicates with Azure AD, retrieving a username and password and continuously refreshing the authentication token. When the Logic App calls the connector, it performs operations like uploading files to SharePoint.