Mailchimp
Not subscribed to OpsMatters Newsletter


By adding new complexity to reliability engineering and making physical war rooms a thing of the past, COVID-19 has imposed permanent changes on incident management. Here’s how SREs can respond.
A big topic of interest nowadays is web application monitoring. Application performance monitoring and log analytics are required by businesses of all sizes to ensure their web applications’ smooth operation. If your application serves as the backend for your business processes, it is critical for your organization. You need to know, in real-time, when and why it breaks. To answer these questions, we will use Logz.io products to monitor a simple web application served by Nginx.
Go to https://circleci.com/build-environments/arm/ to learn more about CircleCI’s Arm compute and sign up for access.
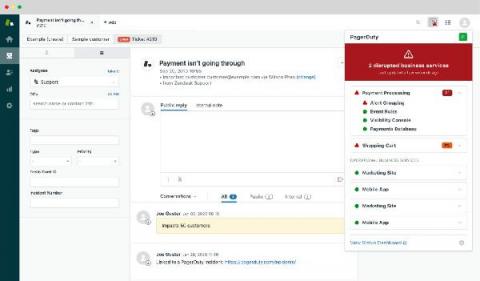
We are delighted to announce a new Status Dashboard for the Zendesk Customer Service integration. The dashboard enables customer service agents to have real-time visibility into major incidents that are impacting their customers within the Zendesk tool suite, so they can proactively update customers when an incident occurs.
In a SOC (security operations center), alerts originating from hundreds of systems compete to get attention. What ensues is a security analyst’s battle to beat alert fatigue while effectively defending their organization from cybersecurity threats. Alert fatigue is a major challenge faced by security operations center (SOC) teams. The stakes are even higher since they take on the enormous responsibility of maintaining networks and data systems.
So you want to build a better dashboard, do you? Well good, you’ve come to the right place! Splunk dashboards are amazing. They are incredibly versatile and customizable. The creation of a dashboard is incredibly simple and can be done all through the UI. If more in-depth customization is required, that can be done through the SimpleXML using HTML panels, in-line CSS, or by uploading a new app from Splunkbase or custom JS/CSS.
Since the OpenTelemetry Tracing Specification reached 1.0.0 — guaranteeing long-term stability for the tracing portion of the OpenTelemetry clients, the community has been busy working to get the SDKs and APIs for popular programming language ready to be GA. Next in our ‘Getting Started with OpenTelemetry’ Series, we’ll walk you through instrumenting a Python application and install both the OpenTelemetry API and SDK.