Mailchimp
Not subscribed to OpsMatters Newsletter


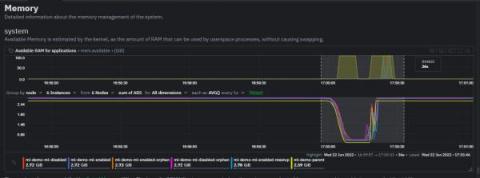
A month ago, we introduced unsupervised ML & Anomaly Detection in Netdata, the Anomaly Advisor. Today, we’re happy to announce that we’re bringing anomaly rates to every chart in Netdata Cloud. Anomaly information is no longer limited to the Anomalies tab and will be accessible to you from the Overview and Single Node View tabs as well. This will make your troubleshooting journey easier, as you will have the anomaly rates for any metric available with a single click.
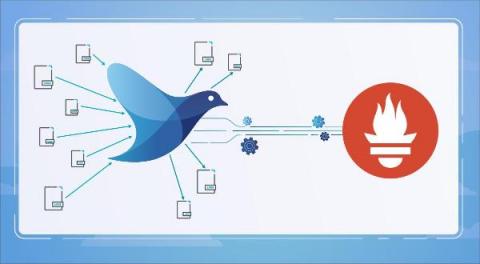
Fluentd is an open source data collector widely used for log aggregation in Kubernetes. Monitoring and troubleshooting Fluentd with Prometheus is really important to identify potential issues affecting your logging and monitoring systems. In this article, you’ll learn how to start monitoring Fluentd with Prometheus, following Fluentd docs monitoring recommendations. You’ll also discover the most common Fluentd issues and how to troubleshoot them.
As the world enters the post-pandemic era, employers and IT teams face a variety of new challenges. Some should be high on the long-term priority list. Others need to be addressed immediately. Here’s a snapshot of what we’re facing: Addressing one or two of these challenges isn’t enough. Success for the Everywhere Workplace means IT navigating all these challenges – and more – simultaneously amid considerable uncertainty.
In the first blog in this three-part series, I discussed why network compliance should be a focus for MSPs. Today I’d like to take you through what service providers can do to meet compliance requirements.
When we came across Dotan’s article “Observability Is a Data Analytics Problem” on LinkedIn, he got our full attention. We totally agree with his views on observability and data analytics.
CI/CD systems follow a multi-tiered environments pattern: development, testing, staging, and production release are all part of this process. Each setting in this cycle could have a variety of set ups and configurations. As a result, having to set up separate configurations for different environments could be inconvenient and burdensome. In this tutorial, we will take a look at what Docker is and how it has freed developers from set-up problems and port clashes.
Retrace is the full lifecycle APM solution that includes tools and capabilities far beyond your typical APM tool. With sophisticated log management, detailed code tracing, deployment tracking and more, Retrace delivers what your DevOps team needs most to resolve issues before impacting users. By extending usability beyond traditional APM functionality, Retrace provides greater value than competitive products. But where would Retrace be without robust APM functionality?
It’s 3PM on a Friday, and your day is winding down. Suddenly, you get an urgent email from your boss asking you to set up an alert for monitoring volume. You consider this an easy task. You set a hard threshold for what you think is a low volume based on the last four hours of incoming data.