Operations | Monitoring | ITSM | DevOps | Cloud
Tracing
The latest News and Information on Distributed Tracing and related technologies.
Traces vs Spans
In the context of application performance monitoring (APM) and observability, traces and spans are fundamental concepts that help users to track and understand the flow of requests and operations within a system. They are essential in assisting users to identify bottlenecks, troubleshoot issues, and optimize application performance.
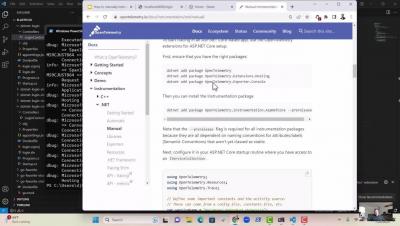
How to Manually Instrument .NET Applications with OpenTelemetry
7 OpenTelemetry Metrics to Track for Better Visibility
In today’s rapidly evolving software landscape, ensuring observability is crucial for building robust and reliable applications. One of the critical components of observability is metrics, which provide valuable insights into the performance and behavior of our systems. OpenTelemetry, an open-source observability framework, offers a standardized approach to capturing, exporting, and analyzing metrics. This blog post explores seven OpenTelemetry metrics for tracking better visibility.
Kubernetes Troubleshooting Reimagined: Operators and Auto-Tracing
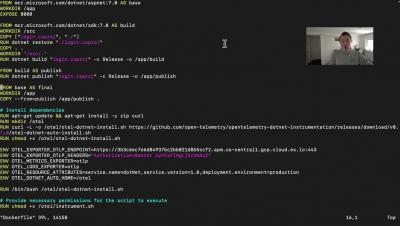
Golang Monitoring using OpenTelemetry
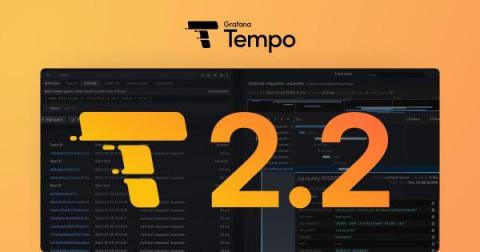
Grafana Tempo 2.2 release: TraceQL structural operators are here!
Get excited about Grafana Tempo 2.2! Not only is this release on time, but it is also chock full of TraceQL features and performance improvements. I was honestly a little shocked by how much we have accomplished in the last three months when summarizing the changelog.
Dive Deeper into your Trace and Logs Data with Query Builder - Community Call Aug 1
Best practices for tracing and debugging microservices
Tracing and debugging microservices is one of the biggest challenges this popular software development architecture comes with - probably the most difficult one. Due to the distributed architecture, it's not as straightforward as debugging traditional monolithic applications. Instead of using direct debugging methods, you'll need to rely on logging and monitoring tools, coding practices, specific databases, and other indirect solutions to successfully debug microservices.


