Operations | Monitoring | ITSM | DevOps | Cloud

Blog

Three Code Instrumentation Patterns To Improve Your Node.js Debugging Productivity

In this age of complex software systems, code instrumentation patterns define specific approaches to debugging various anomalies in business logic. These approaches offer more options beyond the built-in debuggers to improve developer productivity, ultimately creating a positive impact on the software’s commercial performance. In this post, let’s examine the various code instrumentation patterns for Node.js.

Product Documentation and Knowledgebase

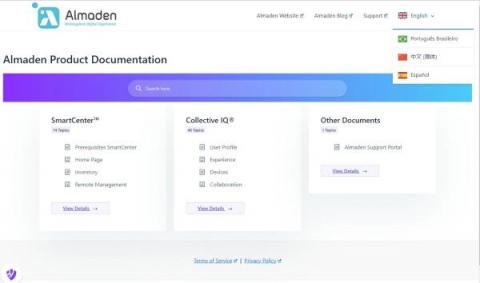
Almaden has launched a dedicated product documentation and knowledgebase site at docs.almaden.app. This new site will enable our customers and partners to quickly and easily search for topics, and review documents and articles. Documentation is segmented by product and you can quickly jump to a Product, or Topic within a product, by clicking on the heading. At the moment we have product documentation for SmartCenter™ and Collective IQ®.

Cribl Makes Waves at Black Hat USA 2023, Unveils Strategic Partnership with Exabeam to Accelerate Technology Adoption for Customers

One of our core values at Cribl is Customers First, Always. These aren’t just buzzwords we use to sound customer friendly; it’s ingrained in our daily communication and workload. Without our customers, we wouldn’t exist. One of the ways we’ve upheld this value is to seek out strategic partnerships with other companies aligned with our customers’ needs – both present and future.

Information Technology (IT): Fundamentals & Core Concepts

Simply defined, Information Technology (IT) is the use of computers and related technology, such as software, cloud-based applications, and networks to communicate or transmit data, build organizational infrastructure, and secure information. Anything a business or organization uses an endpoint device for could technically be classified as IT.

Measuring the time between spans in an OpenTelemetry trace with a Clickhouse query

In a recent conversation on our SigNoz community Slack, a user shared their query that asks a deceptively simple question: what is the average time between two spans in a trace? The usefulness of this answer is evident if you think about how often the total trace time does not highlight the time you care about most. This could mean any number of things: that the total trace time of handling a web request might include lots of spans after a satisfying response was sent to the user.

Kubernetes Liveness Probe Guide

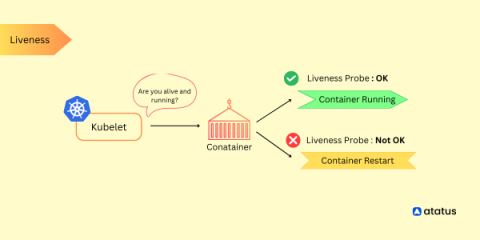
Kubernetes liveness probes are a critical component for monitoring the health and availability of application containers running within a Kubernetes cluster. They allow Kubernetes to determine whether a container is running as expected and take appropriate actions if it is found to be unresponsive or in an unhealthy state. Liveness probes periodically check the health of containers by sending requests to a specified endpoint or executing a command within the container.

9 Popular Kubernetes Distributions You Should Know About

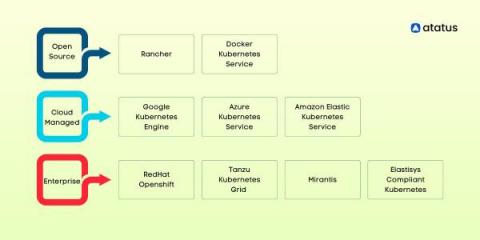
Kubernetes has become the go-to platform for container orchestration, allowing teams to more efficiently manage their containerized applications. Vanilla Kubernetes, as well as managed Kubernetes, are the two options available when building up a Kubernetes system. A group of programmers using vanilla Kubernetes must download the source code files, follow the code route, and set up the machine's environment.

DataDog Flex Logs vs Coralogix Remote Query

While Coralogix Remote Query is a solution to constant reingestion of logs, there are few other options today that also offer customers the ability to query unindexed log data. For instance, DataDog has recently introduced Flex Logs to enable their customers to store logs in a lower cost storage tier. Let’s go over the differences between Coralogix Remote Query vs Flex Logs and see how DataDog compares. Get a strong full-stack observability platform to scale your organization now.