Operations | Monitoring | ITSM | DevOps | Cloud

Blog

The Future of Business Monitoring is Here & it's Autonomous

As the business world continues to integrate AI and machine learning to better manage big data processes, one area that arguably has benefitted the most is business monitoring. From IT management to business intelligence, the last few years have seen a drastic shift in how companies are monitoring their data.

What Can Pandora FMS Offer as a Server Monitoring Tool?

When your server goes down, it can certainly throw a wrench into your daily processes, costing you money and even causing you to lose customers until it’s back up and running again. Thankfully, Pandora FMS can help you prevent it from happening, and in the worst-case scenario when it does, you have the tools to get back up and running again in no time with our server monitoring solution!

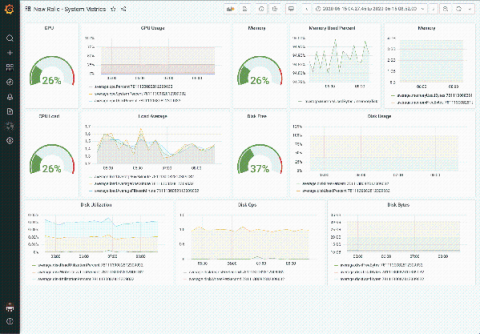
A conversation about Grafana Labs' new partnership with New Relic

In helping users unify and contextualize all their observability data, Grafana is completely database-agnostic. “We believe that organizations get the best view of what’s going on when they pull in their data from wherever it lives,” said Raj Dutt, CEO of Grafana Labs, the company behind Grafana.

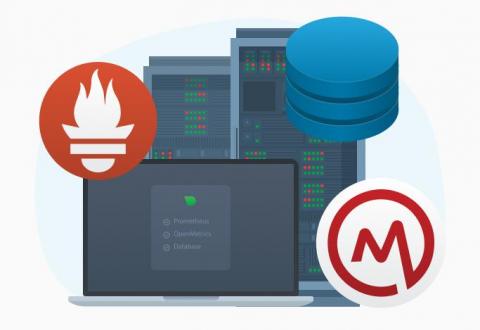
Netdata Agent v1.24: Prometheus/OpenMetrics collector and multi-host database mode

This release broadens our commitment to open standards, interoperability, and extensibility with a new generic Prometheus collector that works seamlessly with any application that makes its metrics available in the Prometheus/OpenMetrics exposition format, including support for Windows 10 via windows_exporter. Netdata will autodetect over 600 Prometheus endpoints and instantly generate charts with all the exposed metrics, meaningfully visualized.

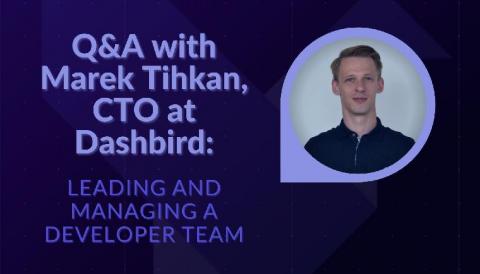
Q&A with Marek Tihkan, CTO at Dashbird: Leading and managing a Developer team

As we enter into our 4th year, we've decided to get up close and personal with our team to share with you their passion, drivers, lessons learned and significant moments of the past year. We're a young company dedicated to adding value in all corners that we reach, so we hope you find the upcoming series useful! Hey Marek, so can you tell us how long you’ve been at Dashbird and where you were before? M: I’ve been at Dashbird for two years now.

How We Use Quarkus With Kafka in Our Multi-Tenant SaaS Architecture

At LogicMonitor, we deal primarily with large quantities of time series data. Our backend infrastructure processes billions of metrics, events, and configurations daily. In previous blogs, we discussed our transition from monolith to microservice. We also explained why we chose Quarkus as our microservices framework for our Java-based microservices. In this blog we will cover.

Getting Started: Writing Data to InfluxDB

This is a beginner’s tutorial for how to write static data in batches to InfluxDB 2.0 using these three methods. Before beginning, make sure you’ve either installed InfluxDB OSS or have registered for a free InfluxDB Cloud account. Registering for an InfluxDB Cloud account is the fastest way to get started using InfluxDB.

Getting Started: Streaming Data into InfluxDB

This is Part Two of Getting Started Tutorials for InfluxDB v2. If you’re new to InfluxDB v2, I recommend first learning about different methods for writing static data in batches to InfluxDB v2 in Part One of this Getting Started series. This is a beginner’s tutorial for how and when to write real-time data to InfluxDB v2. The repo for this tutorial is here. For this tutorial, I used Alpha Vantage’s free “Digital & Crypto Currencies Realtime” API to get the data.

How to "Translate" Grafana Dashboards from Prometheus to Elasticsearch

In the field of open-source metrics and time series monitoring, it is quite clear today that Grafana is the most popular tool of choice. One of Grafana’s main advantages is its storage backend flexibility. It can support almost all the major time series datastores (Prometheus, InfluxDB, Elasticsearch, Graphite etc.), when each datastore has its own query language syntax, and slight differences in the actual Grafana UI and capabilities resulting from these differences.