Operations | Monitoring | ITSM | DevOps | Cloud

The Upsun Performance Agent: a diagnosis instead of a call graph

The data to explain a slow endpoint is usually already sitting in your project. Blackfire has the profile. Continuous profiling has the flame graph. The traffic numbers show which route matters. The code is in git. What takes the afternoon is putting those four things next to each other and working out which function is responsible. That afternoon is what the Upsun Performance Agent is for.

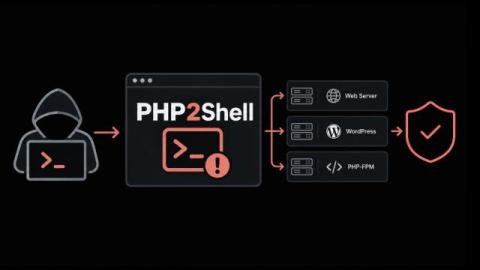
How Upsun handled PHP2Shell: protection in place 22 hours before the patch

On 21 October 2026, the team behind PHP released an emergency fix for two critical security flaws. PHP is the programming language behind a large share of the web, including WordPress, Drupal and many online stores. Researchers at Wiz named the flaws PHP2Shell. An attacker could use them to take control of a website without ever logging in. Updating a website, its CMS, or its plugins doesn't help. The only real fix is (and was) a new version of PHP itself.

What Four Leadership Circles Revealed About Operationalizing DEX

Earlier this year, I spent time with technology leaders across four major cities – San Diego, Boston, London and Dallas, as part of four Leadership Circles. Taken together, the conversations reinforced how far digital employee experience has matured for many organizations. The focus has shifted from understanding why DEX matters to exploring what it takes to operationalize its success. San Diego focused on the changing role of IT and the strategic case for DEXOps.

How to Patch PHP2Shell Across Every Server and Prove Each Fix to Auditors

When a critical flaw surfaces in the language behind a large share of your web applications, how quickly can your organization name every server that runs it? PHP2Shell puts that question in front of every IT leader who runs PHP. The answer decides how long the business stays exposed. Here's the short version. PHP2Shell covers two flaws in the PHP engine, and either one lets an attacker run code on a web server with no login at all.

VMware Monitoring: Why Opslogix continues to be the right choice for you

In December 2021 we wrote VMware Monitoring: Why Opslogix is the right choice for you. At the time, vSphere 7 was new, Kubernetes was coming to vSphere, and the Log4j vulnerability was in the news. A lot has changed since then. vSphere 9 and SCOM 2025 are here, ransomware gangs now target ESXi hosts directly, and many organizations are reconsidering how they monitor their VMware estate.

Should you use a log or a metric?

Since Sentry added Logs and Application Metrics, there are now two ways to record that something happened in your app, and they can look pretty similar: Sentry.logger.info("user.signup") versus Sentry.metrics.count("user.signup"). Both store attributes, both include shared context automatically, and both can be filtered, grouped, and counted. So when you’re instrumenting your code, which one do you reach for?

Shipped: Create a Jira ticket from a cost spike, with status synced both ways

When Monitors flags a cost spike, the fix usually belongs to an engineering team, and that team might track their work in Jira. Now you can hand the incident to them from CloudZero in one click. The Jira ticket and the CloudZero incident stay in step. When the engineer resolves the ticket, the incident resolves too. You track the work in one place, and the status you see in CloudZero matches what the team is doing.

Capping the AI free-for-all? Know what each dollar returns first.

Most companies gave everyone AI access and thought they’d sort out the costs later. Engineering, support, product, marketing, and finance all got licenses to the best models. The early results looked good, and for a while it didn’t matter there wasn’t an explicit business case. Let’s call the first half of 2026 the free-for-all period for many companies. AI adoption spread across the org fast, people and teams loved it, and then the invoices started coming in.

Optimize AI costs with Agent Observability

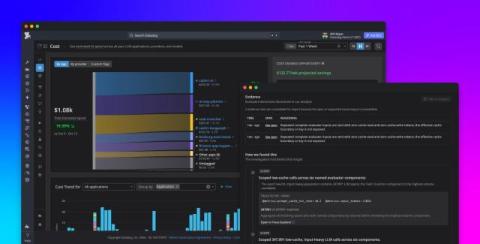
AI agent costs accumulate along more dimensions than a model-call count. Spend is a product of both which models you call and how the agent is architected: how many turns the loop runs, how many tools it invokes, how much retrieved context it carries, and how much of that context is re-sent on every turn. Provider bills tell you how much you spent, but they’re keyed to API keys and models instead of the applications and workflow steps that generated the calls.