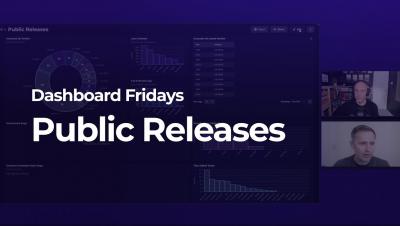
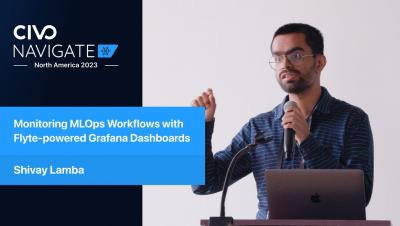
Operations | Monitoring | ITSM | DevOps | Cloud

Dashboards

How we use the Grafana GitHub plugin to track outstanding pull requests

First of all, we’re pleased to announce the first release of the GitHub data source. The source code is available at github.com/grafana/github-datasource. Contributions, feature requests, and bug reports are welcome. Using the GitHub data source, Grafana users can visualize data from GitHub’s API. In this blog, we’ll go over some use cases for this handy plugin.

Introducing Grafana Metrics Enterprise, a Prometheus-as-a-service solution for enterprise scale

Today, we announced the launch of a new Grafana Labs product: Grafana Metrics Enterprise, a scalable Prometheus-compatible service designed for large organizations that is seamless to use and simple to maintain. Over the past few years, Prometheus has risen in popularity to become the de facto monitoring system for the cloud native ecosystem around Kubernetes — and for good reason.

Keeping Clean with CloudZero Dashboard: Our Latest Updates

Here at CloudZero, we’ve made some updates to our dashboard that we’re excited to share with you! I actually prefer this original definition. When you hear the word dashboard, if you’re not thinking about software, you’re probably picturing the place in a car where you have various dials and readouts for safe operation of the vehicle. But did you know what the term dashboard predates cars?

Dashboards Beta v0.7: Export Dashboard to PNG/PDF and Self-Service Install for Splunk Cloud

If you’re new to the Dashboards Beta app on Splunkbase and you’re trying to get started with building beautiful dashboards, this "Dashboards Beta" blog series is a great place to start. The Splunk Dashboards app (beta) brings a new dashboard framework, intended to combine the best of Simple XML and Glass Tables, and provide a friendlier experience for creating and editing dashboards.

How Grafana Labs is reorganizing for growth

As you most likely know, Grafana Labs is growing. Growing like crazy! As Goutham Veeramachaneni noted in his blog post, “~30 people in March 2018 and now, in August 2020 we’re 180+ people. That is 6x growth in 2.5 years.” And we have no intention of slowing that growth. Matter of fact, we’re hiring as quickly as we can — and on top of that keep hiring specialists just to scale out hiring even more.

How to maximize the value of SCOM - Monitoring, Alerts, Incidents & Visualization

In SCOM you can see the monitoring that generates your alerts (the contents of Health Explorer). While SCOM doesn’t always make it easy to get at the valuable context that this monitoring data provides, it is there and can help answer the "why" questions that often come up when looking at an alert in isolation.

How To 'Translate' Grafana Dashboards from Graphite to Elasticsearch

Grafana is the de facto open source tool for visualizing metrics. Grafana supports many different backends for data sources and handles each one slightly differently. This blog post is geared towards helping convert Grafana dashboards from using the Graphite backend to using Elasticsearch as a metrics datasource. There are many similarities between how to use both as datasources and how to plot graphs around them, but there are also many differences that need to be accounted for.