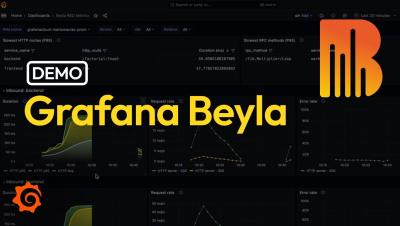
Operations | Monitoring | ITSM | DevOps | Cloud

Unify and query private network data in Grafana Cloud: Private Data Source Connect is now GA

You may be ready to make the move to Grafana Cloud, but securely querying private data has been a blocker. If you wanted to query a network-secured data source like a MySQL database or an Elasticsearch cluster that is hosted in an on-premises private network or a Virtual Private Cloud (VPC), you needed to open your network to inbound queries from a range of IP addresses.

How to securely send your telemetry to Grafana Cloud using AWS PrivateLink

Using Grafana Cloud to manage and monitor even your most sensitive data from your AWS services just got easier. If your organization’s workloads are hosted in AWS and you are using a Grafana Cloud instance that’s also hosted in AWS, you can now use AWS PrivateLink to establish a secure connection between your virtual private cloud (VPC) network and Grafana Cloud for all your data.

AWS PrivateLink for Grafana Cloud

Navigating secure connectivity and managing data transfer costs are vital to optimizing your cloud-based services. AWS PrivateLink offers a solution to improve security and reduce costs, especially when integrating with Grafana Cloud. In this tutorial, we delve into the problems solved by PrivateLink, its working mechanism, and a step-by-step guide on configuring it to connect to Grafana services. What You'll Learn.

The Single Pane of Glass in Modern Observability

Recently I caught up with Jamie Allen on Episode 67 of the Slight Reliability podcast to discuss the idea of a single pane of glass (SPOG). Jamie had written an article titled The Single Pain of Glass which coincidentally was what I titled Slight Reliability Episode 10. I thought given our shared use of puns and this topic that it was worth a conversation! So, what is a single pane of glass? Is it an idea with practical application? How does it fit into the world of modern observability?

How continuous profiling improved code performance for a new Grafana Loki feature

Throughout the software development process, engineers can use a number of methods and tools to ensure their code is efficient. When using Go, for example, there are built-in tools, including those for benchmarking and CPU/memory profiling, to check how efficiently code will run. Engineers can also run unit tests to validate code quality.

Reducing data center carbon emissions with Hardware Sentry, Grafana, and OpenTelemetry

With just 30 employees, Sentry Software might be considered a small company, but they’re prioritizing sustainability in a big way. As the makers of Hardware Sentry, an IT monitoring software, a large part of their business relies on maintaining optimal temperature conditions at their data centers — an operation that contributes to the company’s overall carbon footprint.

How to deploy Grafana on Kubernetes (Grafana Office Hours #13)

Senior Developer Advocates Nicole van der Hoeven and Usman Ahmad talk about how to deploy Grafana on Kubernetes for beginners: what Kubernetes is, how it's an evolution of distributed computing, what its relationship to Docker is, other things you might need to know to work with Kubernetes, and how you can deploy Grafana on your own Kubernetes clusters.

Introducing Grafana OnCall shift swaps: A simpler way to exchange on-call shifts with teammates

A family member’s birthday, that concert you’ve waited all year to see, an impromptu weekend getaway with friends — there are a lot of reasons software engineers might want to switch on-call shifts. And rather than have to frantically send Slack messages to your teammates, wouldn’t it be nice to automate the process and quickly find the coverage you need?

Customer Workshop 2023

This month, we were thrilled to welcome SquaredUp customers from all over the world to our in-person workshop in sunny Marlow, UK. It was a wonderful day of learning and sharing ideas, and a unique opportunity for SquaredUp users to meet the people behind the product (us!), network with like-minded customers, and get an exclusive look at the latest product updates. We were excited to showcase our Dashboard Server product roadmap and share our vision for the future of SquaredUp.

Data Visualization for Everyone: How To Simplify the Process

Nowadays, data is being generated at an unprecedented pace. Data is collected everywhere, from various social media platforms to e-commerce websites. This explosion of data has made it almost impossible to make sense of it through traditional methods. This is where data visualization comes into the picture. Data visualization enables companies to interpret vast amounts of information and draw conclusions quickly. It allows users to analyze data in a more accessible and straightforward way.