Operations | Monitoring | ITSM | DevOps | Cloud

Dashboards

How to build insightful M365 Analytics Dashboards with SquaredUp and Microsoft Graph API (Part 2)

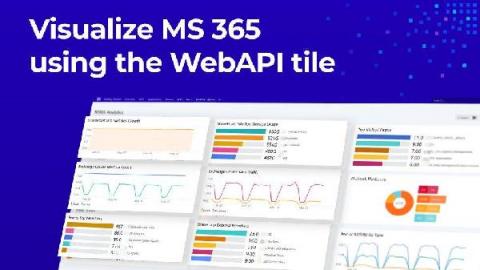
In the last blog post, I walked you through how to connect to the Microsoft Graph API so you can start pulling in the M365 analytics to create a dashboard in SquaredUp. In this blog post, I’ll walk you through exactly how to create this dashboard. This dashboard will allow you to monitor key metrics for Microsoft 365 SharePoint, Exchange Online, and Teams so you can be proactive in assigning storage.

Dashboard Server: Working with the WebAPI tile

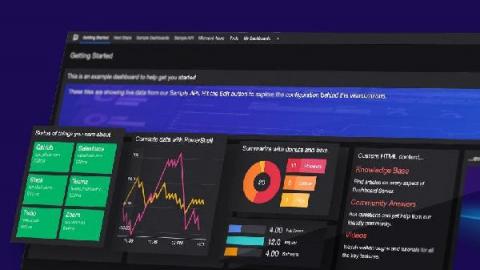
Now that we’ve familiarized ourselves with the basics, let’s get on creating our first dashboard! I spot an familiar tile here, the WebAPI tile. This tile is available in the SquaredUp SCOM and Azure products too. WebAPI tile is the way you bring external data into SquaredUp. As long as the tool you’re connecting to has an API endpoint that returns data in JSON payload, you can work with that data to display the data in a dashboard in SquaredUp.

Building Kibana dashboards more efficiently

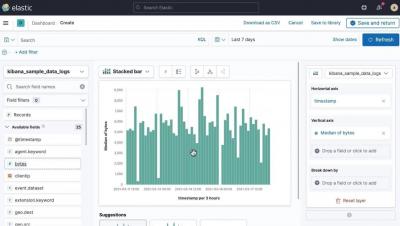
Creating dashboards is quicker and easier than before with a new streamlined navigation experience, now available in Kibana 7.12. This dashboard-first approach makes it simple for you to create and add visualizations without leaving your dashboard-building flow. Get started directly from a Kibana dashboard with a few simple steps: Select Create Panel and choose what type of visual you want to build.

How to build insightful M365 Analytics Dashboards with SquaredUp and Microsoft Graph API (Part 1)

It’s incredibly helpful to be able to visualize the data produced by your organization’s M365 tenant so you can manage licenses, usage, capacity, and more. SquaredUp dashboards are ideal for this. You can use the WebAPI Tile in SquaredUp to connect to the Microsoft Graph API, which offers a broad set of functionalities for working with Azure via code. Microsoft 365 sits on top of Azure and can be managed via Graph API, too.

Easily monitor your Tencent Cloud services with the new Grafana plugin

Plugins make it easier for Grafana users to get faster time to value. With a few clicks, you can start tapping into the different data stores you and your business already leverage — and see them all in one place in your Grafana dashboard. I’m a huge fan of partner-developed plugins for a few reasons, with my favorite being subject matter expertise. Who better to develop your plugin than the team that knows the product inside out?

How to Collect and Visualize Windows Events From 5 Hosts in 5 Minutes

If you’re investigating incidents on your Windows hosts, sifting through the Event Viewer can be a painful experience. It’s best to collect and ship Windows Events to a separate backend for easier visualization and analysis – but depending on the solution you choose, this can take some significant legwork. Often, this can require manually configuring a 3rd party tool or agent, just to get started.

Announcing OpenSearch: Doubling Down on Open Source

Today, I’m excited to officially announce our support for the OpenSearch project, the new fork of the Elasticsearch and Kibana codebases. As we previously shared, Logz.io has the utmost commitment to its customers and the community to ensure that these open-source technologies will prosper by being built for the community and guided by the community.

How we use metamonitoring Prometheus servers to monitor all other Prometheus servers at Grafana Labs

One of the big questions in monitoring can be summed up as: Who watches the watchers? If you rely on Prometheus for your monitoring, and your monitoring fails, how will you know? The answer is a concept known as metamonitoring. At Grafana Labs, a handful of geographically distributed metamonitoring Prometheus servers monitor all other Prometheus servers and each other cross-cluster, while their alerting chain is secured by a dead-man’s-switch-like mechanism.