Operations | Monitoring | ITSM | DevOps | Cloud

Dashboards

Grafana 7.5 released: Loki alerting and label browser for logs, next-generation pie chart, and more!

Grafana v7.5 has been released! This is the last stable release before we launch Grafana 8.0 at GrafanaCONline in June. Register for free now, so you won’t miss the great sessions we’re planning around all things Grafana. And if you’re doing something special with Grafana that you’d like to share with the community, the CFP for GrafanaCONline is open until 06:59 UTC on April 10! Now, back to 7.5.

Circonus Welcomes New Dashboard Builder and Service Dashboards

Over the past few months, we’ve been working on some major updates to Circonus — a new dashboard builder and interface along with several turnkey service dashboards. In the following post, we’ll share the motivation and process behind this project, then walk you through what you can expect. Circonus has provided the ability to create custom drag and drop dashboards for some time. However, this feature was added several years ago.

How I fell in love with logs thanks to Grafana Loki

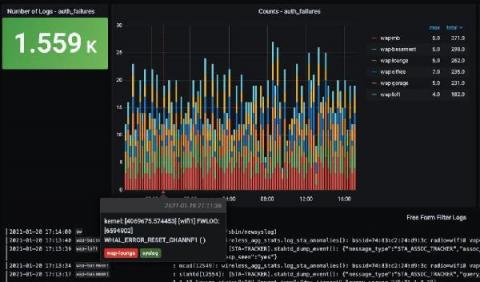
As part of my job as a Senior Solutions Engineer here at Grafana Labs, I tend to pretty easily find ways out of technical troubles. However, I was recently having some Wi-Fi issues at home and needed to do some troubleshooting. My experience changed my whole opinion on logs, and I wanted to share my story in hopes that I could open up some other people’s eyes as well. (I originally posted a version of this story on my personal blog in January.) First, some background info.

What's new in Grafana Cloud for March 2021: improvements to alerting, synthetic monitoring, and more

As the product manager for Grafana Cloud, I am constantly following the progress of all the new features that our engineering teams are working on, from early ideation to release. We’re always excited to share updates with the community, so you can all try them out and let us know what you think. So each month, I’ll be rounding up the latest Grafana Cloud features and improvements on the blog.

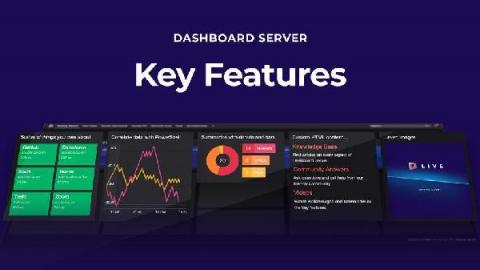
Visualize your DevOps data for free

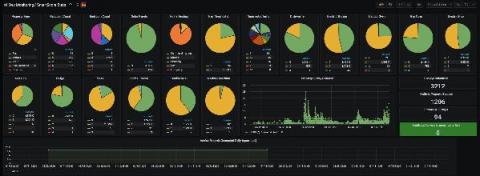
We recently launched the public preview of a new tool that lets anyone dashboard anything – for free. Meet Dashboard Server! You can download it free because we wanted to get our incredible dashboards in the hands of more people. The SCOM community know us well but our dashboards are perfect for so many use cases beyond System Center monitoring. And if you love them as much as we think you will, all we ask in return is that you share that love by spreading the word.

Logz.io Infrastructure Monitoring: Building Visualizations in Dashboards

In a previous post I explained how to send metrics to Logz.io Infrastructure monitoring with Prometheus—now let’s analyze them by building Prometheus dashboards and visualizations in our metrics UI! Once you’ve started to send metric data to Logz.io, how do you visualize and interpret that data so that it’s useful for you? Logz.io Infrastructure Monitoring provides powerful querying and visualization of your data.

Why implementing Grafana Enterprise was a bright idea for U.K. energy supplier Utilita

Energy efficiency is a term often used to describe appliances or light bulbs. But when it comes to business, making sure your sales team — and customers — are being efficient with their personal energy is a big key to success. That was a major lesson learned by Utilita, the U.K.’s first and only specialist Smart Pay As You Go Energy supplier.

Working with the WebAPI tile - tips & tricks

Regardless of the SquaredUp product you use, the WebAPI tile is very useful when it comes to connecting to external data sources and showing them in your dashboards. It brings you closer to that single pane of glass dashboarding dream that we all have, which is why it is also one of our most used tiles!