Operations | Monitoring | ITSM | DevOps | Cloud
Troubleshoot failed performance tests faster with Distributed Tracing in Grafana Cloud k6
Performance testing plays a critical role in application reliability. It enables developers and engineering teams to catch issues before they reach production or impact the end-user experience. Understanding performance test results and acting on them, however, has always been a challenge. This is due to the visibility gap between the black-box data from performance testing and the internal white-box data of the system being tested.
Top 10 Mistakes People Make When Building Observability Dashboards
Observability dashboards are powerful tools that enable teams to visualize and monitor the performance, health, and behavior of their applications and infrastructure. However, building observability dashboards is not a straightforward task, and many organizations make common mistakes hindering their ability to gain meaningful insights and respond to issues effectively.
How to correlate performance testing and distributed tracing in Grafana Cloud k6
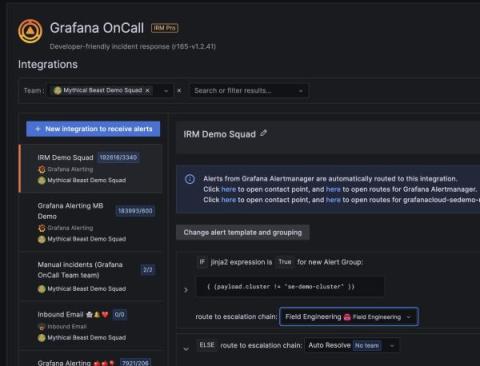
A better Grafana OnCall: Delivering on features for users at scale
Enterprise IT is just a different animal. Whether it’s operating at scale, undertaking massive migrations, working across scores of teams, or addressing tight security requirements, engineers at these organizations can face different obstacles than their counterparts at smaller organizations and startups.
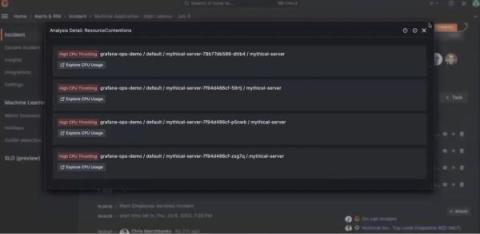
Announcing Sift: automated system checks for faster incident response times in Grafana Cloud
When faced with an incident, there are two areas that demand your immediate attention: the incident investigation, and the cross-functional coordination needed to resolve the issue. Grafana Incident helps with the collaboration by providing a central hub for communication across teams that seamlessly integrates with the tools you are already using, such as Slack or Microsoft Teams. But how can you best use your telemetry data to debug your application and bring your systems back online?
Rapid Performance Analysis using Developer Tools
In the world of performance testing there is a heavy focus on the practice of load testing. This requires building complex automated test suites which simulate load on our services. But load testing is one of the most expensive, complicated, and time consuming activities you can do. It also generates substantial technical debt. Load testing has its time and place, but it's not the only way to measure performance.
Introducing Grafana Beyla: open source ebpf auto-instrumentation for application observability
Do you want to try Grafana for application observability but don’t have time to adapt your application for it? Often, to properly instrument an app, you have to add a language agent to the deployment or package. And, in languages like Go, proper instrumentation means manually adding tracepoints. Either way, you have to redeploy to your staging or production environment once you’ve added the instrumentation.


