Operations | Monitoring | ITSM | DevOps | Cloud
Anomaly Detection
Anomaly Rates in the Menu!
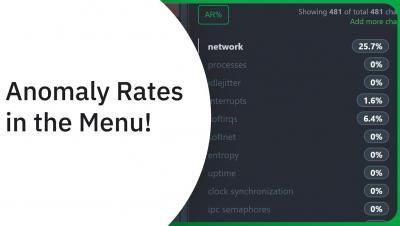
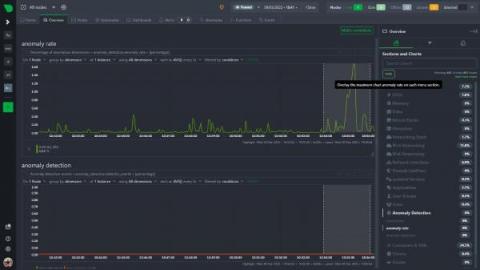
The menu (on the overview or single node tab) now has an anomaly rate button built into it that, for the entire visible window or a highlighted time range, shows the maximum chart anomaly rate within each section. Read on to learn more about this new feature!
Machine-Learning Automation: Processing, Storing, & Analyzing Data in the Digital Age
The world of software is growing more complex, and simultaneously changing faster than ever before. The simple monolithic applications of recent memory are being replaced by horizontal cloud-native applications. It is no surprise that such applications are more complex and can break into infinitely more ways (and ever new ways). They also generate a lot more data to keep track of. The pressure to move fast means software release cycles have shrunk drastically from months to hours, with constant change being the new normal.
Anomaly detection on Prometheus metrics
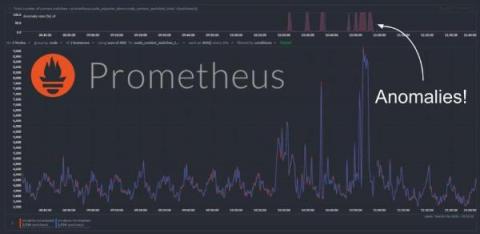
We have recently extended the native machine learning (ML) based anomaly detection capabilities of Netdata to support all metrics, regardless on their collection frequency (update every). Previously only metrics collected every second were supported, but now Netdata can run anomaly detection out of the box with zero config on metrics with any collection frequency.
Using Cribl Search for Anomaly Detection: Finding Statistical Outliers in Host CPU Busy Percentage
Using Cribl Search for Anomaly Detection: Finding Statistical Outliers in Host CPU Busy Percentage
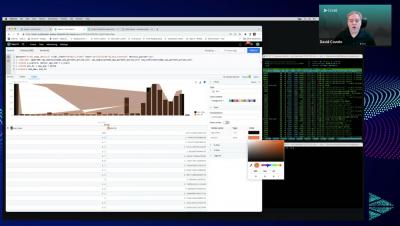
In this blog post, we’ll demonstrate how to use Cribl Search for anomaly detection by finding statistical outliers in host CPU usage. By monitoring the “CPU Busy” metric, we can identify unusual spikes that may indicate malware penetration or high load/limiting conditions on customer-facing hosts. The best part? This simple but powerful analytic is easily adaptable to other metrics, making it a versatile tool for any data-driven organization.
Extending Netdata's anomaly detection training window
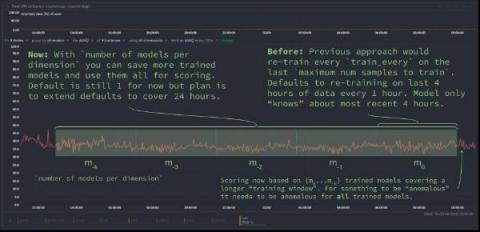
We have been busy at work under the hood of the Netdata agent to introduce new capabilities that let you extend the "training window" used by Netdata's native anomaly detection capabilities. This blog post will discuss one of these improvements to help you reduce "false positives" by essentially extending the training window by using the new (beautifully named) number of models per dimension configuration parameter.
What are AIOps use cases?
The past decade has seen organizations embrace AI and data analytics at scale. In 2022, IBM found that 35% of organizations have embraced AI—a 4% increase from 2021. The trend of AI adoption will continue to play out in the next several years across virtually every organizational function. At the vanguard of this movement is AIOps, which sees AI used to improve IT operations (ITOps).
Using AIOps for Better Adaptive Incident Management
An effective incident management strategy is crucial for any business, especially those offering consumer-facing digital services. This is because when incidents occur, they may be easily detected by your users, impact your reputation, and ultimately affect your bottom line. So, to minimize the reach and severity of incidents, your response needs to be swift and effective. One way to ensure your approach meets these requirements is to implement AIOps.
Introducing Outlier Detection in Grafana Machine Learning for Grafana Cloud
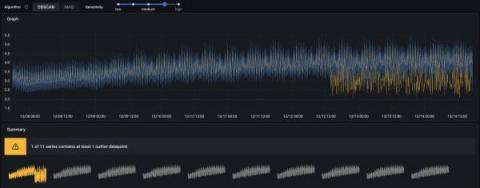
Outlier Detection is now available as part of the Grafana Machine Learning toolkit in Grafana Cloud for Pro and Advanced users. With this feature, you can monitor a group of similar things, such as load-balanced pods in Kubernetes, and get alerted when some of them start behaving differently than their peers. There’s supposed to be a video here, but for some reason there isn’t. Either we entered the id wrong (oops!), or Vimeo is down.


