Operations | Monitoring | ITSM | DevOps | Cloud
Critical Automation: Anomaly Detection for Application Observability
How AIOps turns anomaly detection into faster incident resolution
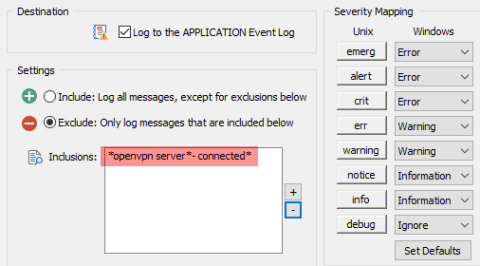
Revealing Suspicious VPN Activity with Anomaly Detection
Webinar Recap: Building an AI Anomaly Detection Pipeline with InfluxDB
Anomaly Detection for Time Series Data: Techniques and Models
Welcome to the third chapter of the handbook on Anomaly Detection for Time Series Data! This series of blog posts aims to provide an in-depth look into the fundamentals of anomaly detection and root cause analysis. It will also address the challenges posed by the time-series characteristics of the data and demystify technical jargon by breaking it down into easily understandable language.
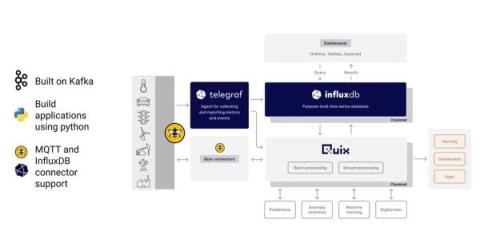
Mage for Anomaly detection with InfluxDB and Half-space Trees
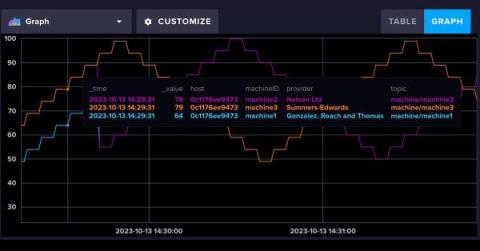
Any existing InfluxDB user will notice that InfluxDB underwent a transformation with the release of InfluxDB 3.0. InfluxDB v3 provides 45x better write throughput and has 5-25x faster queries compared to previous versions of InfluxDB.
EventSentry v5.1: Anomaly Detection / Permission Inventory / Training Courses & More!
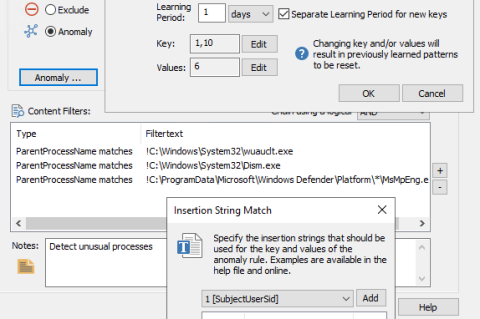
We’re extremely excited to announce the availability of the EventSentry v5.1, which will detect threats and suspicious behavior more effectively – while also providing users with additional reports and dashboards for CMMC and TISAX compliance. The usability of EventSentry was also improved across the board, making it easier to use, manage and maintain EventSentry on a day-by-day basis. We also released 60+ training videos to help you get started and take EventSentry to the next level.
Anomaly Detection for Time Series Data: Anomaly Types
Welcome to the second chapter of the handbook on Anomaly Detection for Time Series Data! This series of blog posts aims to provide an in-depth look into the fundamentals of anomaly detection and root cause analysis. It will also address the challenges posed by the time-series characteristics of the data and demystify technical jargon by breaking it down into easily understandable language. This blog post (Chapter 2) is focused on different types of anomalies.
Anomaly Detection for Time Series Data: An Introduction
Welcome to the handbook on Anomaly Detection for Time Series Data! This series of blog posts aims to provide an in-depth look into the fundamentals of anomaly detection and root cause analysis. It will also address the challenges posed by the time-series characteristics of the data and demystify technical jargon by breaking it down into easily understandable language. This blog post (Chapter 1) is focused on.


