Operations | Monitoring | ITSM | DevOps | Cloud

Tracing

The latest News and Information on Distributed Tracing and related technologies.

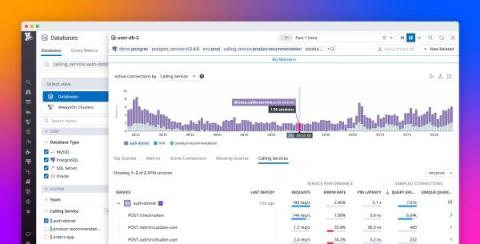
Seamlessly correlate DBM and APM telemetry to understand end-to-end query performance

When the services in your distributed application interact with a database, you need telemetry that gives you end-to-end visibility into query performance to troubleshoot application issues. But often there are obstacles: application developers don’t have visibility into the database or its infrastructure, and database administrators (DBAs) can’t attribute the database load to specific services.

Troubleshoot failed performance tests faster with Distributed Tracing in Grafana Cloud k6

Performance testing plays a critical role in application reliability. It enables developers and engineering teams to catch issues before they reach production or impact the end-user experience. Understanding performance test results and acting on them, however, has always been a challenge. This is due to the visibility gap between the black-box data from performance testing and the internal white-box data of the system being tested.

Native OpenTelemetry support in Elastic Observability

OpenTelemetry is more than just becoming the open ingestion standard for observability. As one of the major Cloud Native Computing Foundation (CNCF) projects, with as many commits as Kubernetes, it is gaining support from major ISVs and cloud providers delivering support for the framework. Many global companies from finance, insurance, tech, and other industries are starting to standardize on OpenTelemetry.

Best practices for instrumenting OpenTelemetry

OpenTelemetry (OTel) is steadily gaining broad industry adoption. As one of the major Cloud Native Computing Foundation (CNCF) projects, with as many commits as Kubernetes, it is gaining support from major ISVs and cloud providers delivering support for the framework. Many global companies from finance, insurance, tech, and other industries are starting to standardize on OpenTelemetry.

Comparing Datadog and New Relic's support for OpenTelemetry data

OpenTelemetry is the future of Observability, APM, Monitoring, whatever you want to call ‘the process of knowing what our software is doing.’ It’s becoming common knowledge that your time is better spent gaining experience with an open, standardized system for telemetry than closed-source or otherwise proprietary standard. This truth is so universally acknowledged that all the big players in the market have made announcements of how they’re embracing OpenTelemetry.

OpenTelemetry Webinar: What *is* the OpenTelemetry API?

We've all read “OpenTelemetry is a collection of APIs, SDKs, and tools.” Okay, great, but which parts are APIs, what's the SDK, and which are the tools? And aren't there supposed to be some standards in there too? Join Nica and Srikanth Chekuri as we explore the OpenTelemetry API and how it fits into your Observability process.

Getting started with OpenTelemetry instrumentation with a sample application

Application performance management (APM) has moved beyond traditional monitoring to become an essential tool for developers, offering deep insights into applications at the code level. With APM, teams can not only detect issues but also understand their root causes, optimizing software performance and end-user experiences. The modern landscape presents a wide range of APM tools and companies offering different solutions. Additionally, OpenTelemetry is becoming the open ingestion standard for APM.

Cloud data control: Introducing the OpenTelemetry Arrow Project

In collaboration with F5, ServiceNow® Cloud Observability is pleased to announce the availability of the OpenTelemetry Arrow Project. This co-donated and co-developed project gives organizations greater control over the data extracted from their cloud applications—as well as a path forward to improve the return on investment (ROI) of that data.

OpenTelemetry Gotchas: Phantom Spans

This guest post is written by Ian Duncan, Staff Engineer - Stability Team at Mercury. To view the original post, go to Ian's website. At work, we use OpenTelemetry extensively to trace execution of our Haskell codebase. We struggled for several months with a mysterious tracing issue in our production environment wherein unrelated web requests were being linked together in the same trace, but we could never see the root trace span.