Operations | Monitoring | ITSM | DevOps | Cloud

Tracing

The latest News and Information on Distributed Tracing and related technologies.

Using Traces for Testing - SigNoz Community Call with TraceTest and DevOps Educator Paulo

This week we welcomed the TraceTest team to talk about how TraceTest can use your OpenTelemetry Traces to do truly deep end-to-end tracing of your stack. We also had Globo engineer and DevOps wizard Paulo Henrique de Morais Santiago, who along with experimenting with SigNoz as a New Relic alternative for Observability, is also the author of one of the top DevOps courses on Udemy. Check out his course at.

Scaling microservices: Challenges, best practices and tools

Scaling the deployment, in order to meet demand or extend capabilities, is a known challenge in many fields, but it’s particularly pertinent when scaling microservices. This article looks at the challenges of scaling microservices and examines best practices to overcome them while maintaining app quality, dev efficiency, and a good developer experience.

OpenTelemetry Webinars - Getting Started with OpenTelemetry

We often get asked, what's the best place to get started with OpenTelemetry - host metrics, traces, or even logs? Hosts Nočnica Mellifera and Pranay will talk about taking your first steps to gathering OpenTelemetry data Below is the recording and an edited transcript of the conversation. Find the conversation transcript below.

Parsing logs with the OpenTelemetry Collector

This guide is for anyone who is getting started monitoring their application with OpenTelemetry, and is generating unstructured logs. As is well understood at this point, structured logs are ideal for post-hoc incident analysis and broad-range querying of your data. However, it’s not always feasible to implement highly structured logging at the code level.

Infinite Retention with OpenTelemetry and Honeycomb

The needs of observability workloads can sometimes be orthogonal to the needs of compliance workloads. Honeycomb is designed for software developers to quickly fix problems in production, where reducing 100% data completeness to 99.99% is acceptable to receive immediate answers. Compliance and audit workloads require 100% data completeness over much longer (or "infinite") time spans, and are content to give up query performance in return.

What is eBPF?

eBPF, or Extended Berkeley Packet Filter, is a kernel technology available since Linux 4.4. It lets developers run programs without adding additional modules or modifying the kernel source code. Think of it as a lightweight, sandboxed virtual machine (VM) within the Linux kernel that lets you run Berkeley Packet Filter (BPF) bytecode that uses certain kernel resources. Utilizing eBPF removes the need to modify the kernel source code and improves the software’s capacity to use existing layers.

OpenTelemetry Webinars - Gathering data with the OpenTelemetry Collector

Join Nočnica Mellifera and Pranay as they discuss architecting and collecting data with the OpenTelemetry Collector. We discuss using Apache Kafka queues to handle OTLP data, and why you probably shouldn't push OTel data straight to Postgres. Below is the recording and an edited transcript of the conversation. Find the conversation transcript below.👇 Nica: Hi everybody! If you're seeing this we're starting up we'll get started in just a moment here.

The Sound of Code: Instrument with OpenTelemetry - Civo Navigate NA 2023

Join Henrik Rexed in this insightful talk as he explores "The Sound of Code" and demonstrates how to instrument your code with OpenTelemetry for improved observability. penTelemetry enables the generation of traces, metrics, and logs, providing valuable insights into application performance and troubleshooting in production environments. The talk covers the components of OpenTelemetry, how to customize telemetry data, and the importance of context in observability solutions.

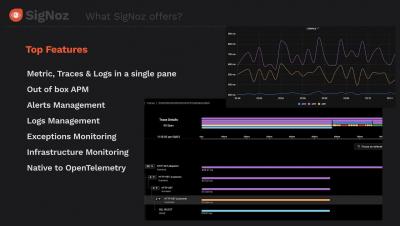
SigNoz Demo - Application Monitoring (APM), distributed tracing, Logs Management, Exceptions, Alerts

Chapters More about SigNoz: SigNoz - Monitor your applications and troubleshoot problems in your deployed applications, an open-source alternative to DataDog, New Relic, etc. Backed by Y Combinator. SigNoz helps developers monitor applications and troubleshoot problems in their deployed applications. SigNoz uses distributed tracing to gain visibility into your software stack. If you need any clarification or find something missing, feel free to raise a GitHub issue with the label documentation or reach out to us at the community slack channel.