Operations | Monitoring | ITSM | DevOps | Cloud

%term

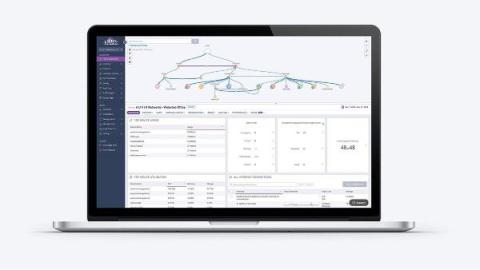
Introducing SNMP Poller History

Despite everyone’s best efforts, network failures happen. And when downtime means lost productivity, fast troubleshooting becomes an integral part of IT operations. So with the addition of SNMP poller history, Auvik providing users an archive for troubleshooting, analysis, and planning. When it comes to managing network issues, diagnosing the root cause is the first step. And often, there’s a gap between when an incident occurs, and when it’s reported. And herein lies a big problem.

How to Dig Deeper on the Network When You Don't Have NetFlow

Bro, I ain’t got flow isn’t only heard at your local hip hop mic night. It’s a gripe from many network administrators who have inherited small environments, networks with lower-end gear, or who are in the trenches dealing with a time-sensitive issue and need to dig deep—now. NetFlow is a Layer 3 protocol that, over time, allows administrators to see how much traffic is being generated, by whom, and where that traffic is going.

How to Use FastAPI [Detailed Python Guide]

FastAPI Python combines modern Python features with high-performance web development capabilities. This framework stands out for its speed, ease of use, and built-in support for asynchronous programming. Whether you're building APIs, microservices, or full-stack applications, FastAPI offers tools to streamline your development process.

Identifying performance bottlenecks in complex applications

Performance bottlenecks can sneak in and slow everything to a crawl regardless of how advanced your application is. These hidden culprits can turn a seamless user experience into a frustrating one. In this blog, we’ll uncover the most common bottlenecks that drag down complex applications and share proven strategies to identify and resolve them. By the end, you'll have the tools to keep your application running at top speed, regardless of the workload.

MSP's Guide to Getting Started With Compliance as a Service

In this episode of Beyond the Horizon, Stefanie Hammond steps in to interview Lewis Pope about the critical role of compliance in the managed services provider (MSP) landscape. They discuss how MSPs can pivot to offer Compliance as a Service (CaaS), the importance of internal assessments, and the challenges faced when implementing compliance strategies. Lewis emphasizes the need for MSPs to adapt to changing client demands, manage internal cultural shifts, and consider partnerships to enhance their compliance capabilities.

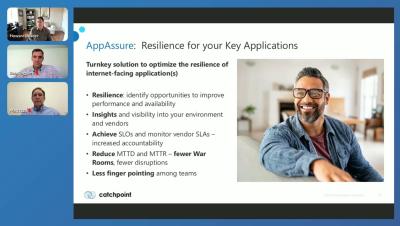
What's New at Catchpoint! Fall 2024 Product Launch Event

Watch our semi-annual launch event hosted by Matt Izzo, CPO, and Howard Beader, VP Product Marketing - with a live demo from Bob Ruggiero, Director of Solutions Engineering. We share details of our Internet Performance Monitoring (IPM) platform strategy, enabling you to monitor what matters from where it matters to get to the answers faster, and highlight our new capabilities around.

How to Configure the OpenTelemetry Operator With Your Kubernetes Cluster | Tutorial | Grafana

In this video, Grafana Labs Staff Solutions Engineer Lionel Marks describes how to configure the OpenTelemetry Operator along with your Kubernetes cluster to automatically inject, configure, and package auto-instrumentation components that you can then monitor in Grafana Cloud Application Observability.

Stronger together: Sumo Logic and AWS partnership expands with five new competencies

For over a decade, we’ve worked closely with AWS to help our joint customers ensure the health and security of their mission-critical applications. That’s why we’re so excited to have recently renewed our Strategic Collaboration Agreement (SCA) with AWS and to announce five new AWS competencies across multiple industries.

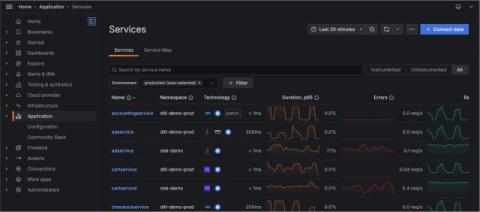
How to quickly configure Grafana Cloud Application Observability with Open Telemetry Operator

Monitoring application health is a lot like monitoring your personal health. Vital signs such as heart rate, blood pressure, and overall well-being can spot problems before they escalate, helping us maintain good health. Similarly, application health requires constant monitoring of performance indicators like CPU usage, memory consumption, and application response times.

Embedded World North America 2024 Recap

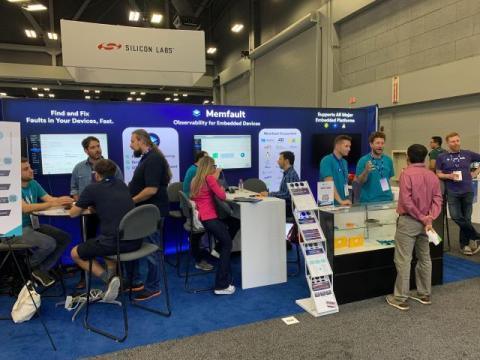
Last week, a handful of Memfolks had the opportunity to travel to Austin to attend the first ever Embedded World North America1! Embedded World NA welcomed 3,500 visitors and 180 vendors across 3 days2. While it was surely a smaller showing than Nueremburg’s Embedded World, we still wanted to quickly touch on our takeaways from the event. In this post, we will cover what we learned from the first Embedded World North America.