Operations | Monitoring | ITSM | DevOps | Cloud

The latest News and Information on Monitoring for Websites, Applications, APIs, Infrastructure, and other technologies.

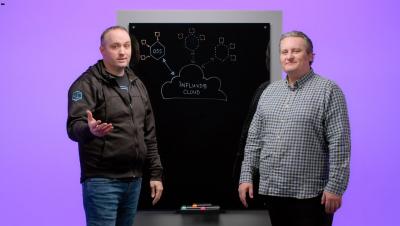
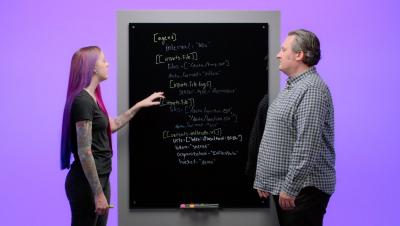
TL;DR InfluxDB Tech Tips - Creating a Telegraf Configuration with the InfluxDB UI

The InfluxDB UI offers a wide variety of features for time series analysis, data lifecycle management, and time series visualization. The InfluxDB UI also shines when it comes to onboarding new users, whether they’re an InfluxDB OSS or free tier InfluxDB Cloud user. The InfluxDB UI allows you to easily leverage Telegraf, a plugin-driven collection agent for collecting, processing, and writing metrics and events.

Why everyone should be using a website monitoring tool right now

It’s easy for us to cruise the net, not really thinking of anything other than exactly what we’re hoping to achieve whether it’s making a payment via online banking or buying a new laptop on Black Friday. But we forget that there’s a whole system working in the background of each and every website, keeping it online and making sure it works to the best of its ability.

Announcing the Control API Suite

As LogDNA has grown, many of our customers have too, meaning that they are bringing in more ingestion data sources and expanding their use cases for their logs. To help with managing more data, we’re excited to introduce the Control API suite. We’ve built 4 individual APIs that will help companies programmatically configure their data and how they want to ingest logs. Below, we’ll cover each new API in detail as well as why they are massively impactful for our customers.‍

Should you care about AIOps? Obviously.

There's a lot of hype in the marketplace about AIOps right now, and there's a lot of people who've got some interesting ideas about what it should be. The most common idea that I hear is that it's essentially a layer of AI magic that sits across everything that you've got in your IT tooling today and then make sense of all of that for you and then we'll decrease the number of incidents you have and reduce your MTTR...

Event and Log Management for Optimized Security and Performance

The full stack isn't just cloud-based, microservices apps, but includes on-premises and hybrid private cloud infrastructure and packaged applications. The challenges associated with aggregating, analyzing, reporting, and alerting intelligently on logs have become more complex than ever due to the acceleration of packaged and customized application deployment in support of business transformation, alongside the growing requirements needed to ensure security and compliance. This webinar will explore multiple methods to ensure compliance, identify threats, and optimize MTTR by monitoring, analyzing, and managing logs across all types of application and infrastructure architectures.

5 Business Insights to Gain From APM

With soaring demand on digital infrastructures, increasing deployment of B2B and B2C custom applications, and ever-tightening budget constraints, it’s more important than ever to ensure service delivery in a cost-effective manner. Delays experienced by your business partners and customers mean higher costs, lost revenue, and lost market share at a time when you can least afford it. In effect, slow is the new down.

New in Grafana 8.2: Test contact points for alerts before they fire

Grafana 8.2 was released last week, and we’re excited to announce one of its new features: contact point testing. Now users of Grafana 8 alerting can test their contact points right from the contact points page. This feature makes it easier to configure Grafana 8 alerting and gives you the confidence in knowing that your contact points are working as expected before they fire. Here are the basics.

Global Manager: Operate Complex IT Environments Across SL1 Stacks In a Single View

Customer Experience is at the heart of ScienceLogic product design, especially making the power of the SL1 platform easy to use. The latest release brings a slew of user interface (UI) and workflow improvements, as well as significant enhancements to the SL1 Global Manager. In this video you’ll learn how Global Manager allows teams to consolidate operations across multiple environments a single dynamic view. You’ll also discover how supporting distributed operations, regional data homing to support regulatory requirements like GDPR, multitenancy, and specialist team support is easier than ever with ScienceLogic SL1.