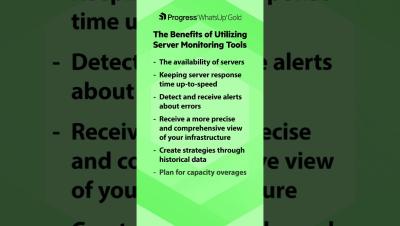
The Benefits of Utilizing Server Monitoring Tools
Server monitoring is beneficial in several ways.


The latest News and Information on Monitoring for Websites, Applications, APIs, Infrastructure, and other technologies.
The OpenTelemetry Collector is a core part of telemetry pipelines, which makes it one of the parts of your infrastructure that must be as secure as possible. The general advice from the OpenTelemetry teams is to build a custom Collector executable instead of using the supplied ones when you’re using it in a production scenario. However, that isn’t an easy task, and that prompted me to build something.
Let’s cut right to it. Read on to learn about all the product updates from our oddly productive December. From new tools to help with debugging while in development to new performance issues, we shipped a handful of new capabilities for every developer.
Since enabling browser profiling on our Sentry.io dashboard a month ago, we have collected over 2M profiles and learned a lot about how our users experience our dashboard. The profiles collected gave us insight into how our dashboard performs in production and surfaced some issues causing UI jank. In this post, we will look at an example of an issue we discovered using Profiling.
This is the third and final blog post in a series about shifting Observability left. If you have not yet read the first two, you can find the first post here and the second post here. Observability is fundamental to modern software development, enabling developers to gain deep insights into their application’s behavior and performance.
In the ever-evolving landscape of software development and IT operations, monitoring tools play a pivotal role in ensuring the performance, reliability, and availability of your applications. Two key disciplines in this domain are observability and Application Performance Management (APM). This post will help you understand the nuances between observability and APM, exploring their unique characteristics, similarities, benefits and differences.
In the latest instalment of our interviews speaking to leaders throughout the world of tech, we’ve welcomed Chris Campbell, CIO at DeVry University.
Observability, in modern software engineering, has evolved into a paramount concept, shedding light on the intricate inner workings of complex systems. Three essential pillars support this quest for clarity: logging, traces, and metrics. These interconnected elements collectively form the backbone of observability, enabling us to understand our software as never before. Think of a system as a bustling city.