Meet the Splunk Global Security Team - #SplunkLife
Members of the Splunk Security & Risk Management team share stories about why they chose security as a profession and why they joined Splunk.


The latest News and Information on Log Management, Log Analytics and related technologies.
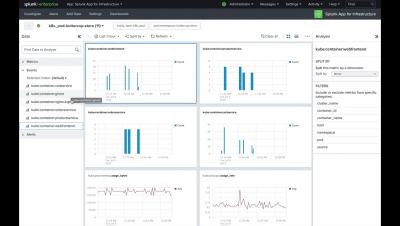
With the release of Grafana v6.3, we are introducing a significant improvement to Loki’s log exploration workflow in Grafana Explore. Launched at KubeCon North America last December, Loki is a Prometheus-inspired service that optimizes storage, search, and aggregation while making logs easy to explore natively in Grafana. Loki is designed to work easily both as microservices and as monoliths, and correlates logs and metrics to save users money.
Launched at KubeCon North America last December, Loki is a Prometheus-inspired service that optimizes storage, search, and aggregation while making logs easy to explore natively in Grafana. Loki is designed to work easily both as microservices and as monoliths, and correlates logs and metrics to save users money. Less than a year later, Loki has almost 6,500 stars on GitHub and is now quickly approaching GA.
Throughout the past few months, I had the opportunity to work with and serve hundreds of Coralogix’s customers, the challenges in performing efficient Log Analytics are numerous, from collecting, searching, visualizing, and alerting. What I have come to learn is that at the heart of each and every one of these challenges laid the challenge of data parsing. JSON structured logs are easier to read, easier to search, alert, and visualize.
Friday, August 2, marked the second beta release for Loki, a long overdue version 0.2.0. Why did it take so long? In large part this was my fault. Having done some work to create a release process for version 0.1.0, I found myself focusing on other things, so improving that process ended up on the backburner. This entire time, in the back of my mind, I was delaying a new release until I could improve that process.
User and entity behavior analytics (UEBA) is a relatively new category of cybersecurity tools that utilize machine learning (ML) algorithms to detect abnormalities in the behavior of the users and entities that belong to an enterprise network. UEBA monitors and continuously learns from the behavior of various user accounts and devices in the network, and establishes a baseline behavioral profile for each using statistical and probability models.
Developer teams and even operational teams often ignore monitoring applications. Deadlines, inexperience, company culture, and management can lead to poor or neglected monitoring inside developing platforms. Automating all monitoring tasks is an excellent way to avoid this scenario. Automation leads to lower costs, less time spent solving issues, and more efficient teams.
In our last post, we covered CloudWatch Metrics in a great deal of detail. We looked at how we can use it to monitor the health of our Lambda functions, including setting up service dashboards as well as alerts. In this post, we will focus on its sister service – CloudWatch Logs. We’ll see how it works and how to get the most out of it.