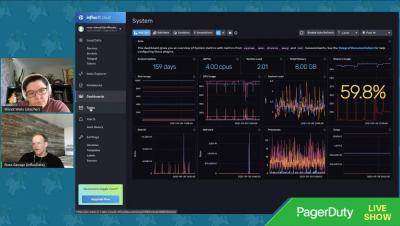
Operations | Monitoring | ITSM | DevOps | Cloud

DevOps 101: Introduction to CI/CD

When you’re new to an industry, you encounter § a lot of new concepts. We tend to use a lot of jargon, the documentation may be written for someone more experienced in mind or rely on contextual knowledge of the rest of the space, and it often doesn’t explain the “why” for the tool. This can make it really difficult to get your feet underneath you in an unfamiliar landscape, especially for junior engineers.

Prometheus monitoring with Sysdig

Prometheus is the de-facto standard for monitoring Kuberentes and cloud-native applications. However, as your Prometheus environment grows, it gets more and more complicated to use and maintain. Prometheus exporters need to be selected, installed, configured, and updated. And PromQL has a steep learning curve. How can you focus on your business, instead of building a monitoring solution?

How to dynamically monitor disks in Windows with Pandora FMS

In this tutorial we're going to see how easy it is to dynamically monitor the disks of our Windows machines with Pandora FMS. To do this, we only need to have the software agent installed on these devices and use the agent plugins that are already loaded by default. We will find two options, to obtain the free space in the disks or the possibility of monitoring the occupied space in these disks. occupied on the disks.

Distributed tracing with OpenTelemetry and Cloud Trace

As more services are involved in serving user traffic and completing transactions, how does each service contribute to overall latency? In this episode of Engineering for Reliability, we’ll show how to use distributed tracing to capture the latency of user requests and how long it takes each service in the path to return a response. Watch to learn how to capture latency in distributed applications using OpenTelemetry and analyze it using Cloud Trace.

Product Explainer Video: Splunk Infrastructure Monitoring for Real-time Monitoring in the Cloud

Wherever you are in your cloud journey and whatever your environment looks like, Splunk Infrastructure Monitoring is a purpose-built metrics platform to address real-time cloud monitoring requirements at scale. Get real-time observability for data from any cloud, any vendor, and any service.

Google Cloud Asset Inventory 101

Cloud Asset Inventory is a metadata inventory service that allows you to view, monitor, and analyze all your Google Cloud and Anthos assets across projects and services. In this video, Sophia Yang - a Google Cloud Product Manager - will show you how Cloud Asset Inventory allows you greater visibility into your Google Cloud assets, receive real-time notifications on asset config changes, run analysis on inventory, getting insights from your deployment, and more! Watch to learn how you can use Cloud Asset Inventory to gain greater observability into your Google Cloud and Anthos assets!