Operations | Monitoring | ITSM | DevOps | Cloud

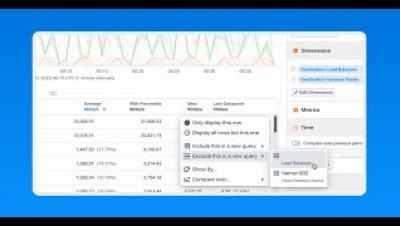
An Introduction to Memfault's IoT Reliability Platform

Memfault's platform includes device debugging, performance monitoring, and over-the-air update capabilities. These not only help streamline the device development process and quickly identify and resolve issues; but additionally provide insights into your device performance, identify trends, and proactively address potential problems before they impact users. Watch to see a demo of our IoT reliability platform.

From Migration to Production-Ready: Compete's Serverless Journey with Lumigo

After migrating to serverless, Compete was tackling the complexities of troubleshooting these complex, dynamic applications. Using Lumigo, however, enabled Compete to find and fix bus in production, in just minutes without logs. Make sure to subscribe so you don't miss out on any new livestreams and observability content! With one-click distributed tracing, Lumigo lets developers effortlessly find and fix issues in serverless and containerized environments.

Introducing the Mattermost OpenOps sandbox for GenAI

OpenOps is an open source, AI-enhanced chat collaboration sandbox to accelerate the responsible evaluation of generative AI models applied to real-world workflows. Use OpenOps to connect a local Mattermost instance with Microsoft Azure AI, OpenAI, and LLMs from Hugging Face and explore AI with full data control in a multi-user pilot for your team.

Troubleshooting an Azure Load Balancer in Kentik Cloud

Achieve in-depth insight into your Azure Load Balancer performance with Kentik Cloud. This video demonstrates how to use Kentik's Data Explorer to filter and analyze Azure traffic, enabling you to evaluate your load balancer's effectiveness and investigate potential performance issues. Learn how to select and use various dimensions of enriched flow data and visualize the balance of traffic through your load balancer. Learn how Kentik can help answer critical performance questions within seconds, streamlining your troubleshooting process.

Azure Virtual WAN Observability with Kentik Cloud

Unravel the complexities of managing your corporate network in the cloud with Kentik Cloud. This video highlights how Kentik Cloud provides a comprehensive, always up-to-date visualization of your hybrid Azure infrastructure, including your Virtual WAN configuration. Learn how to quickly and easily navigate through your infrastructure's architectural blueprint, delve into the performance of specific VWAN hubs, and access vital utilization details. See how Kentik Cloud can help turn tedious troubleshooting into an efficient, user-friendly process. Experience firsthand the power and convenience of having crucial network insights right at your fingertips.

Optimize Azure Costs and Boost Network Performance with Kentik

Explore how Kentik's cloud network observability tools can enhance your Microsoft Azure experience. This video demonstrates how Kentik's rich insights can help you troubleshoot faster, optimize costs, and answer questions about your network across major public clouds. Watch a real-world example of how you can use Kentik to identify under-utilized Azure firewalls, consolidate VNets, and effectively reduce your cloud bill. Discover how Kentik's connectivity, device, utilization, and performance data combined with real-time analysis can fast-track problem-solving and optimize resources.